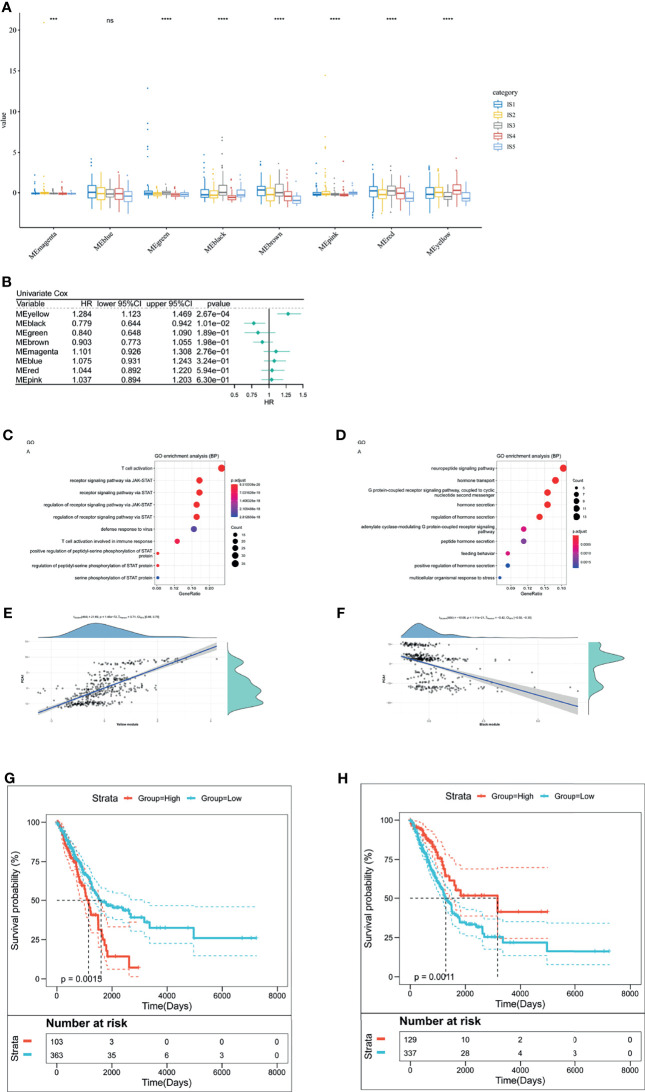
Figure 8.
The analysis of LUAD-related hub genes. (A) Differential distribution of five LUAD-related ISs in each module. (B) Forest maps of survival analysis of eight LUAD modules. ***p < 0.001, ****p < 0.001. ns presents no difference. (B, C) Enrichment map of biological processes in the yellow module (C). The dot size stands for the number of events. The color intensity stands for the enrichment level. The correlation between the yellow module and PCA1 component in immune landscape (D). (E, F) Enrichment map of biological processes in the black module (E). The dot size stands for the number of enrichment genes. The color intensity stands for the enrichment level. The correlation between the black module and PCA1 component in immune landscape (F). (G) Kaplan–Meier curves of the yellow module with low group scores and high group scores. (H) Kaplan–Meier curves of the black module with low group scores and high group scores.

