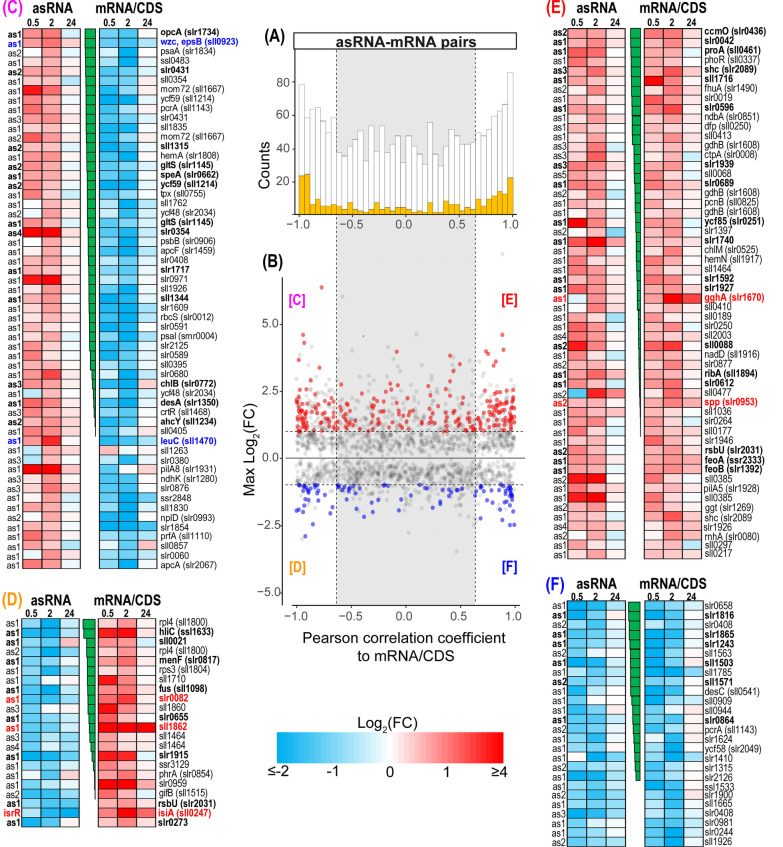
Fig. 3.
Comparison of salt-regulated mRNA:asRNA pairs with inverse or similar induction patterns. A Histogram of Pearson correlation coefficients for expression profiles of all detected asRNA/mRNA pairs. Highlighted are asRNA/mRNA pairs, which both were assigned to an expression cluster with significant differential expression at least at one-time point. B Scatterplot of maximum absolute log2 fold changes for every asRNA vs. Pearson correlation coefficients to its cognate mRNA. Colored points show the expression cluster assignment for the respective asRNA (red = cluster 1 + 2; blue = cluster 3 + 4). White backgrounds indicate strong correlation between asRNA/mRNA pairs (either ≥ 0.65 or ≤ -0.65). Numbers of individual cluster assignments for asRNA/mRNA pairs are indicated in the boxes. C 57 pairs were asRNA-induced and mRNA-repressed, D 22 pairs were asRNA-repressed and mRNA-induced, E 56 pairs were asRNA- and mRNA-induced, F 26 pairs were asRNA- and mRNA-repressed. Only asRNA/mRNA pairs are given, which both were assigned to an expression cluster with a Pearson correlation coefficient of either ≥ 0.65 or ≤ -0.65 at least at one-time point. The heat maps illustrate the log2(FC) at the individual measurements from the microarray experiments for asRNAs (left) and mRNAs (right). The heatmaps are sorted according to Pearson correlation coefficient (center). Examples that are mentioned in the text are highlighted based on their expression. Bold font indicates at least two significant differential expression measurements per transcript. Details of the asRNA/mRNA analysis are given in Additional file 1: Table S4

