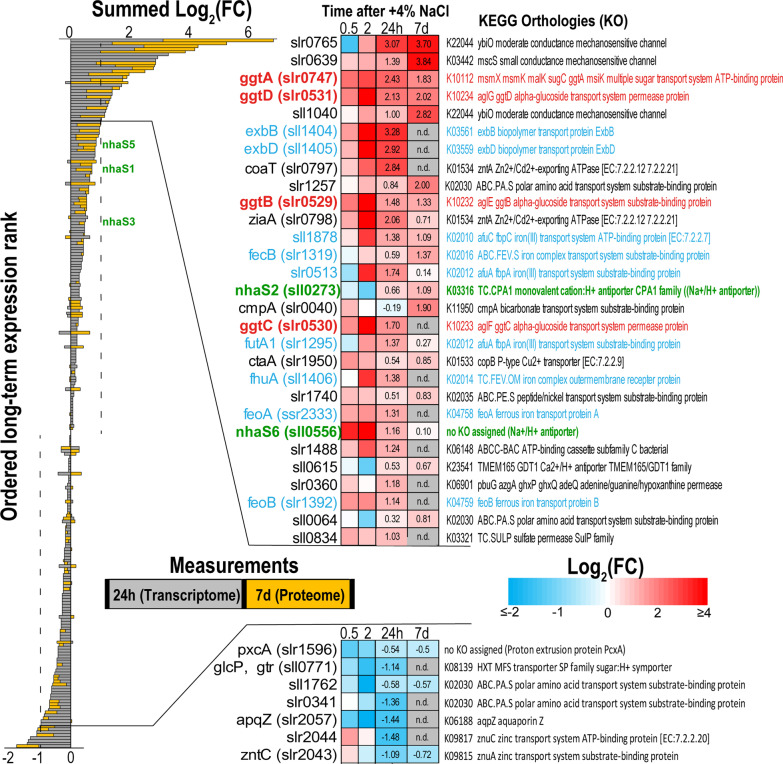
Fig. 7.
Ordered long-term expression ranks for transport-related genes. Ranks are ordered according to the summed Log2(FC) from the 24 h (transcriptome) and 7 d (proteome) measurements of salt-acclimated cells vs. control cells. The heatmaps on the right illustrate the log2(FC) at the individual measurements from the microarray experiment (0.5, 2, and 24 h) and proteome measurements (7 d) for the top ranked transport related genes. Highlighted in Red = compatible solute transport (ggtABCD); Blue = related to iron transport, Green = nhaS genes (Na+/H+ antiporter). Detailed information is provided in Additional file 1: Table S9

