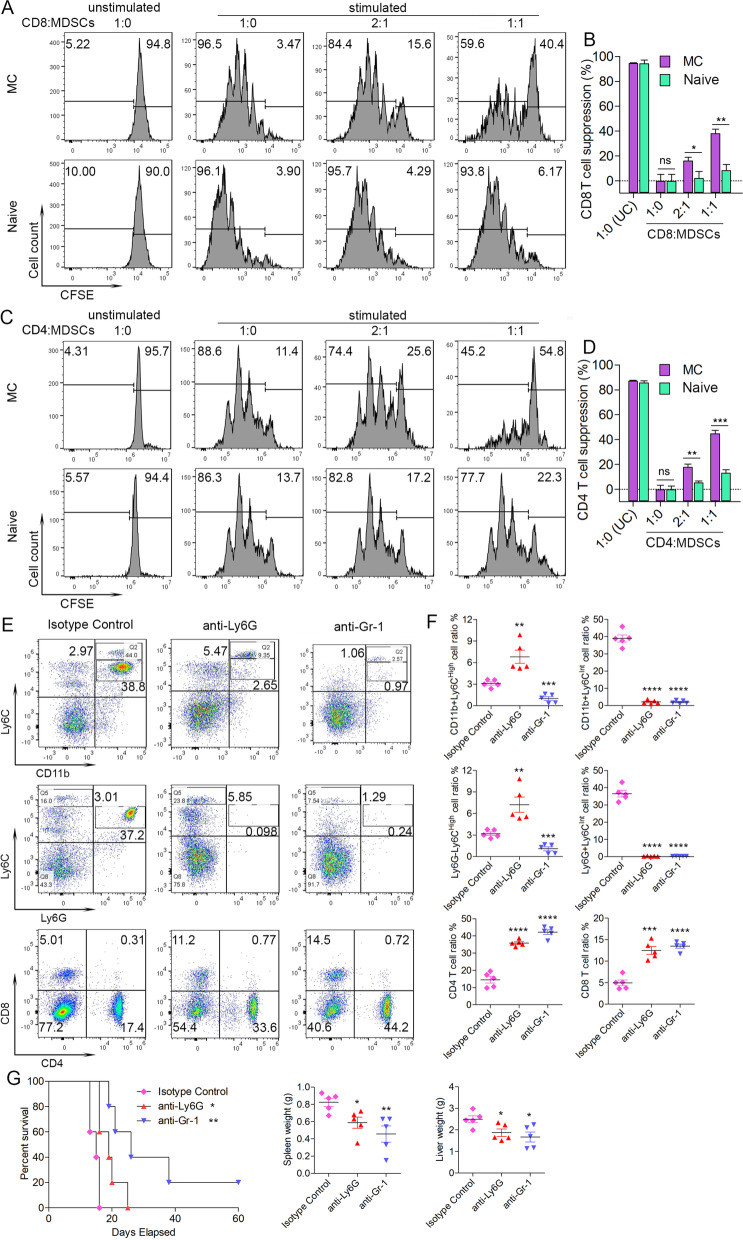
Fig. 5.
In the MDSC suppression assay, when CFSE stained CD8+ T-cells derived from mice xenografted with BBC2 KO#7 cells were co-cultured with MDSC obtained from mice xenografted with MC BBC2 cells at different concentrations (N = 3), there is a proportional reduction in proliferation compared with co-cultured MDSC obtained from naïve wild type mice (A and B). Unstimulated CD8+ cells do not proliferate whether derived from MC-engrafted or naïve mice. Stimulation of CD8+ cells proliferation in these cultures were performed with mouse CD3/CD28 Dynabeads (Gibco). CD8+ cells in the absence of MDSC show the same rates of proliferation for the MC and naïve cells. Suppression of cell proliferation in the stimulated cells was proportional to the relative level of MDSC (B). When the same experiments were performed using CD4+ cells derived from KO#7 cell engrafted mice, the same suppression were seen (C and D). In vivo MDSCs depletion assays were then performed using either anti-Ly6G or anti-Gr-1 antibodies (E-G). Compared with mice treated with the isotype control antibodies, treatment of mice with anti-Ly6G antibody leads to a significant depletion of CD11b + Ly6Cint gMDSC, with a passive increase of the CD11b + Ly6Chi mMDSC, while treatment of anti-Gr-1 antibody leads to depletion in both the CD11b + Ly6Cint gMDSC and CD11b + Ly6Chi mMDSC (E and F). In these analyses cell ratios for each immunophenotype are compared individually with those seen in the isotype control group. As a result of MDSC depletion, there is an increase in the CD4+ and CD8+ cell populations (E and F lower). Consistent with the increased presence of T cells, survival of KO#7 cells engrafted mice treated with the anti-Ly6C or anti-Gr-1 antibody was extended significantly, compared with the isotype treated mice, with one mouse of the anti-Gr1 treated mice remaining disease free at the end of observation (G). Disease progression was associated with decreases in liver and spleen weights compared with the isotype control (G). ns = not significant, * p < 0.05, ** p < 0.01, *** p < 0.001, **** p < 0.0001

