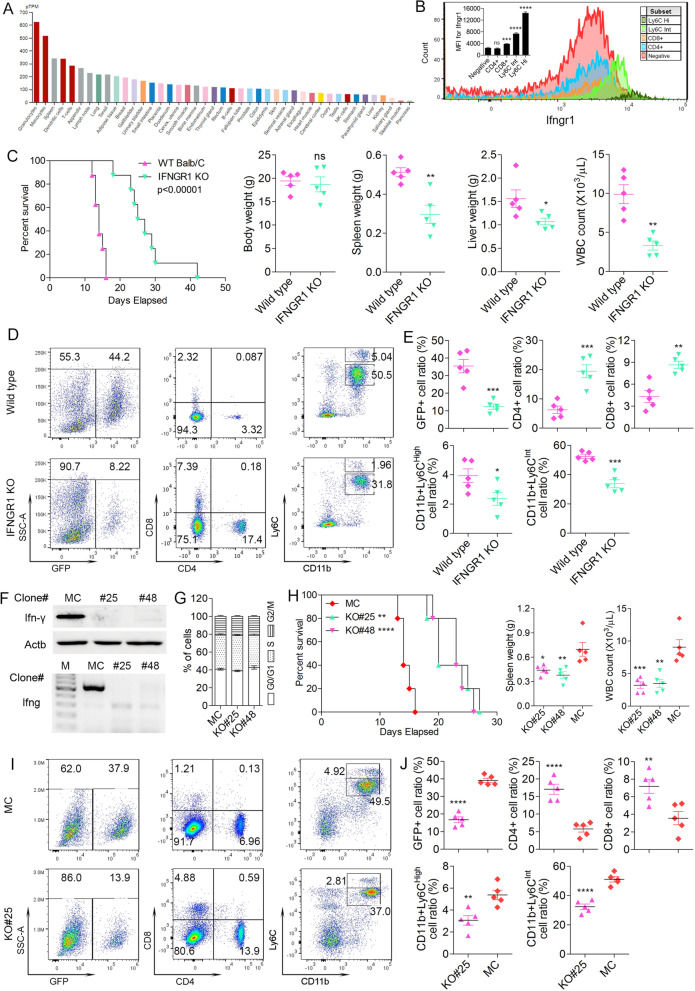
Fig. 7.
Relative expression levels (A) of the IFNGR1 in various cell types as reported in the Human Protein Atlas database. Flow cytometric analysis (N = 3) of IFNGR1 confirms its predominant presence in both CD11b + Ly6Cint and CD11b + Ly6Chi myeloid cells (B) compared to CD4+/CD8+ cells and rest negative cells from wild type BALB/c mice. Kaplan-Meier analysis (N = 8) shows that when BBC2 cells were engrafted into host wild type BALB/c or Ifngr1 null mice (C), there is a significant increase in survival time in the Ifngr1 KO mice, which is reflected in spleen weight and GFP+ cells in the spleen (N = 5). Representative flow cytometry demonstrates reduced leukemic GFP+ cells in the spleens from Ifngr1 null mice, a reduction in levels of Ly6C+/CD11b + MDSC and an increase in CD4+/CD8+ cells compared with wild type mice engrafted with BBC2 cells (D; N = 5). These changes are quantified in (E). Western blot analysis (F, above) and genomic DNA PCR (F, below) identifies IFNG knockout in BBC2 cell clones #25 and #48. Cell cycle analysis shows that IFNG KO cells do not show any differences in cell cycle progression (G). Mice xenografted with these two KO clones show extended survival compared with MC cells engfraftment group, which is reflected in spleen weight and WBC counts (H; N = 5). Immunophenotyping at the time of sacrifice (I and J) shows a significant decrease in GFP+ leukemia cells in the KO#25 cell engraftyed mice compared with MC. These same KO cell engrafted mice showed a significant increase in CD4+ and CD8+ cells and a significant reduction in levels of CD11b+/Ly6Chi mMDSCs and CD11b+/Ly6Cint gMDSCs. ns = not significant, * p < 0.05, ** p < 0.01, *** p < 0.001, **** p < 0.0001

