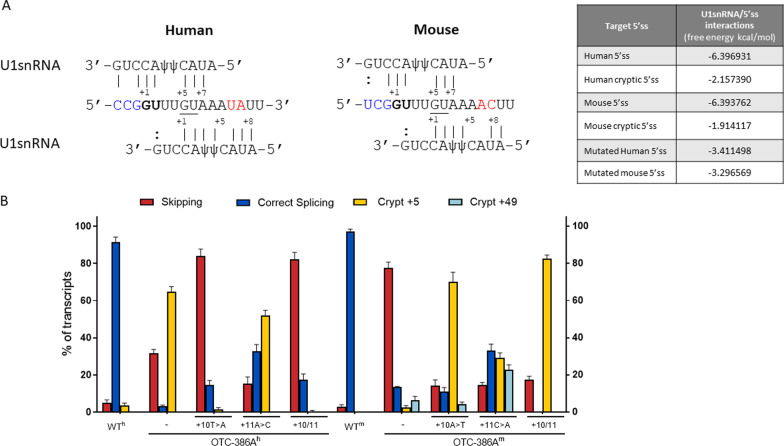
Fig. 2.
Nucleotide variations at +10-11 positions dictate species-specific splicing patterns. A Base pairing between the 5′ tail of the U1snRNA and the authentic (bold) or cryptic (underlined) 5′ss of human and mouse OTC pre-mRNA. Intronic nucleotides at position +10-11 are show in red. Continuous lines represent perfect matches while dashed line indicates partial complementarity. Nucleotides of OTC exon 4 are highlighted in blue. The minimum free energy (MFE) scores of interactions between the 5′ tail of U1snRNA and the targeted 5′ss are reported in the table on the right. B Splicing patterns of OTCh and OTCm minigenes, either wild-type (wt) or mutated, in HepG2 and Hepa1-6, respectively. Bar plots report the relative percentage of each transcript, expressed as mean ± standard deviation (SD) from three independent experiments. The transcript type is indicated on the top

