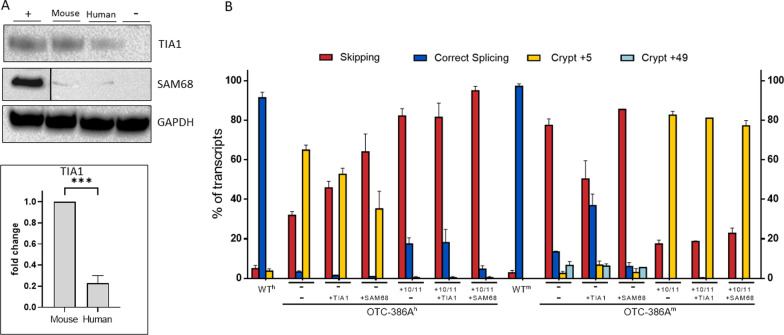
Fig. 3.
TIA1 preferentially binds nucleotide variations at +10-11 positions in mouse. A Western blot analysis of pulldown assays. Results are presented as mean ± standard deviation (SD) of three independent experiments and a representative blot is shown (NE nuclear extract input; C- naked beads). Histograms report fold changes over the wild-type. *p < 0.1; **p < 0.01; ***p < 0.001; ****p < 0.0001. B Splicing patterns of OTCh and OTCm minigenes in Hepa1-6/HepG2 cells expressing minigenes variants alone or in combination with TIA1 or Sam68-expressing plasmids. Bar plots report the relative percentage of each transcript, which is expressed as mean ± standard deviation (SD) from three independent experiments. The transcript type is indicated on the top

