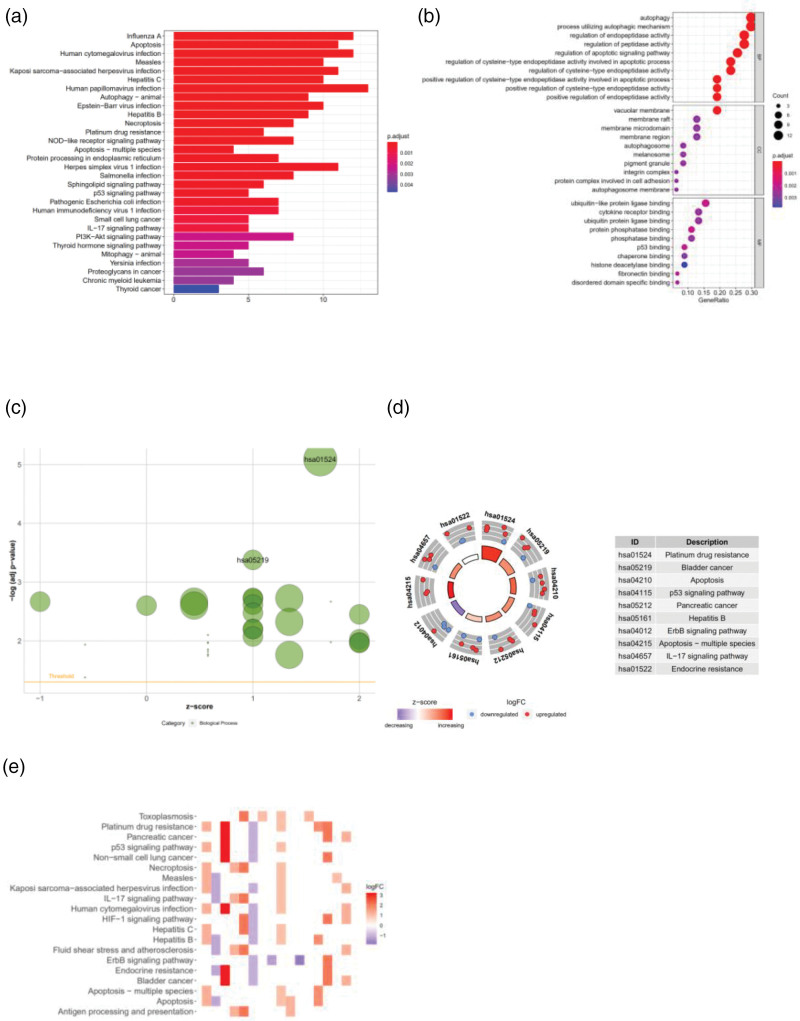
Fig. 4.
(a) BarPlot of the KEGG enrichment analysis of 47 autophagy-related lncRNA genes (red represents signaling pathways that are highly enriched, purple represents signaling pathways that are moderately enriched, and blue represents signaling pathways that are lowly enriched). (b) Bubble plot of the KEGG enrichment analysis of 47 autophagy-related lncRNA genes. (c) Bubble plot of the enriched signaling pathways (green represents BP, red represents CC, and blue represents MF). (d) Circle plot of the enriched signaling pathways (count number=10; red indicates upregulated genes, and blue indicates downregulated genes). (e) Heatmap of the enriched signaling pathways (darker color indicates greater signal pathway enrichment). Data processing and analysis were performed by R software (Version 4.0.2). CC, cellular component; BP, biological process; KEGG, Kyoto Encyclopedia of Genes and Genomes; MF, molecular function.

