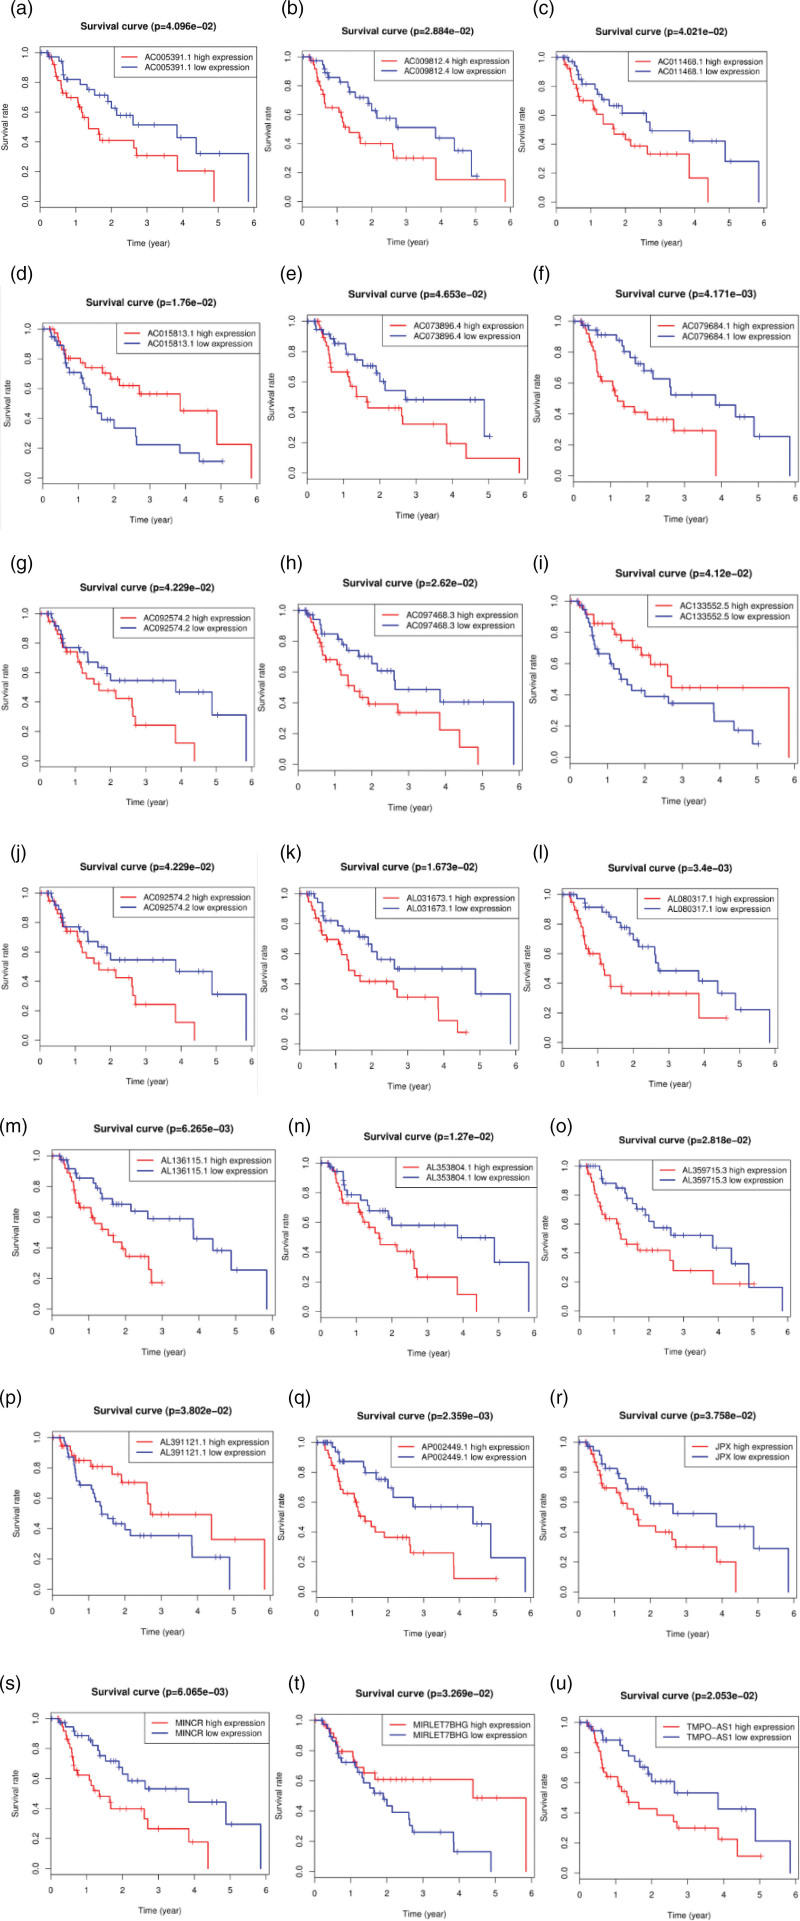
Fig. 5.
Kaplan–Meier survival curves of the overall survival (OS) of patients with esophageal adenocarcinoma (a–u) (red line: high expression of autophagy-related lncRNA genes; blue line: low expression of autophagy-related lncRNA genes). P < 0.05 indicates a significant difference, and P > 0.05 indicates no significant difference.

