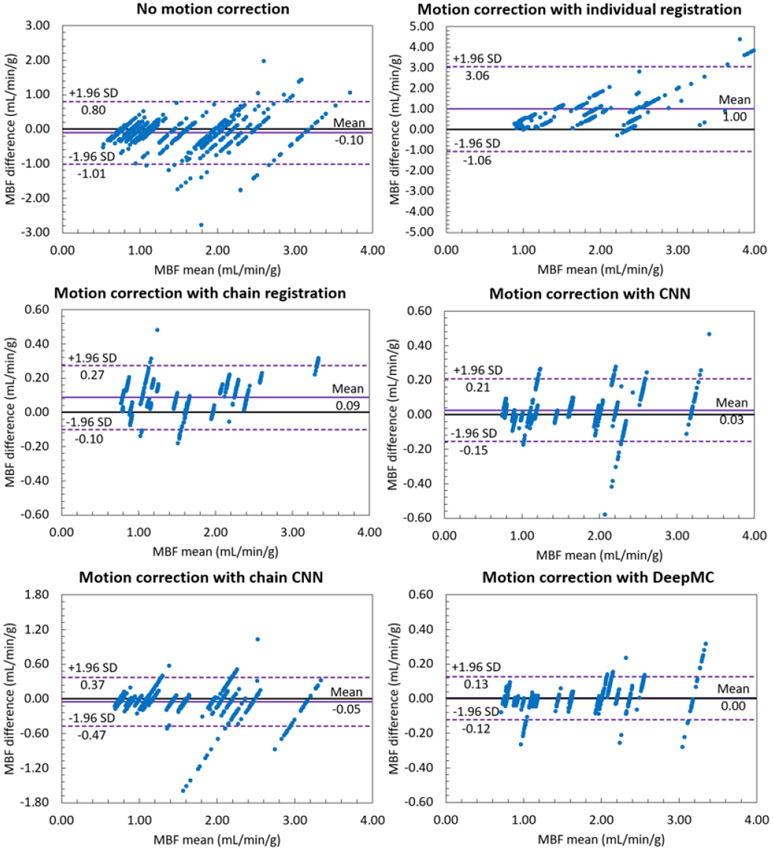
Fig. 8.
The Bland-Altman plots of the MBF estimation between the motion-corrected and motion-free groups. Each one of the parallel clusters (20 in total) represents the results from the 30 motion replicates derived from each of the 20 motion-free patient scans. Note the scale difference of the y-axis for different groups.

