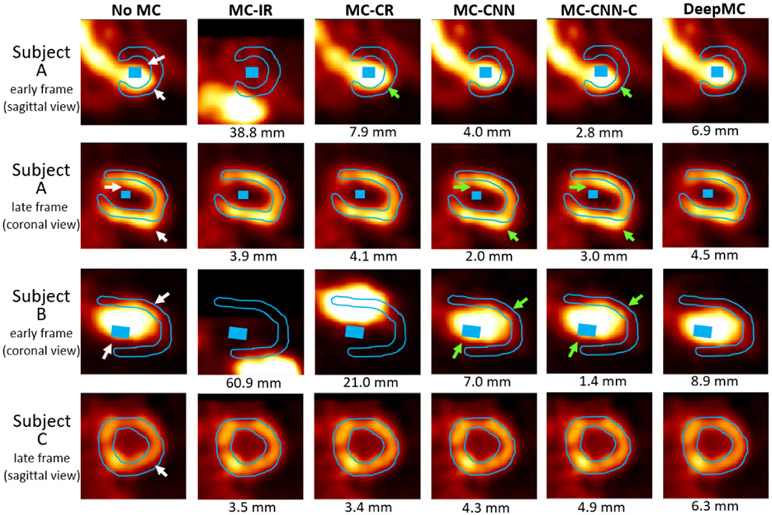
Fig. 9.
Examples of the image frames from three subjects before and after motion correction selected from three patient scans. The LV myocardium and blood pool ROIs drawn on the last frame were overlaid with the images (the blood pool ROI was not shown on the selected slice for Subject C). The white arrows pointed out the mismatches caused by motion when no motion correction was applied (noMC). The green arrows pointed out the residual mismatches after motion correction in some of the results. The motion magnitudes detected by different motion correction methods were also shown beneath the images.

