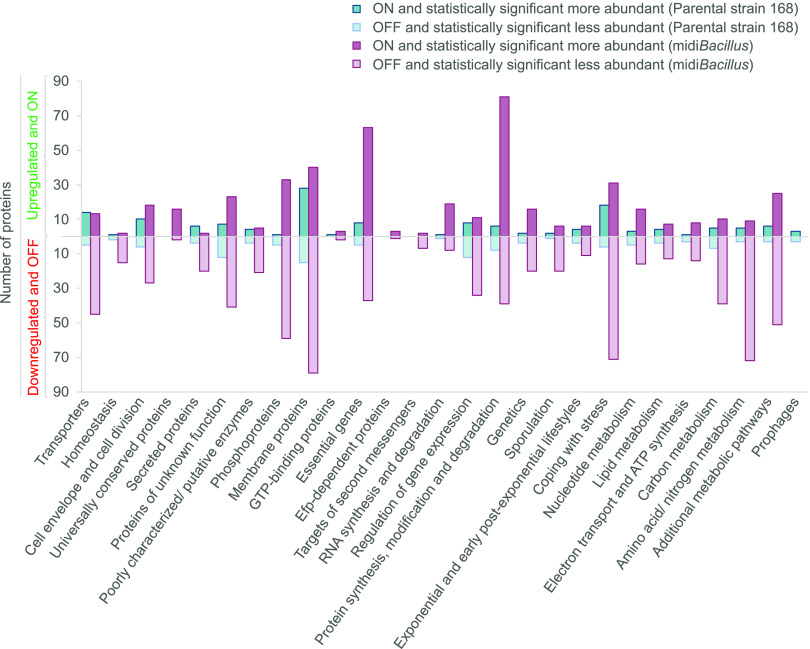
FIG 4.
Total numbers of ON, OFF, and significantly regulated proteins upon induction of IsaA production per functional category. In the upper part of the plot, the numbers of upregulated and ON proteins are presented. In the lower part, in a mirror scale, the numbers of downregulated and OFF proteins are presented.

