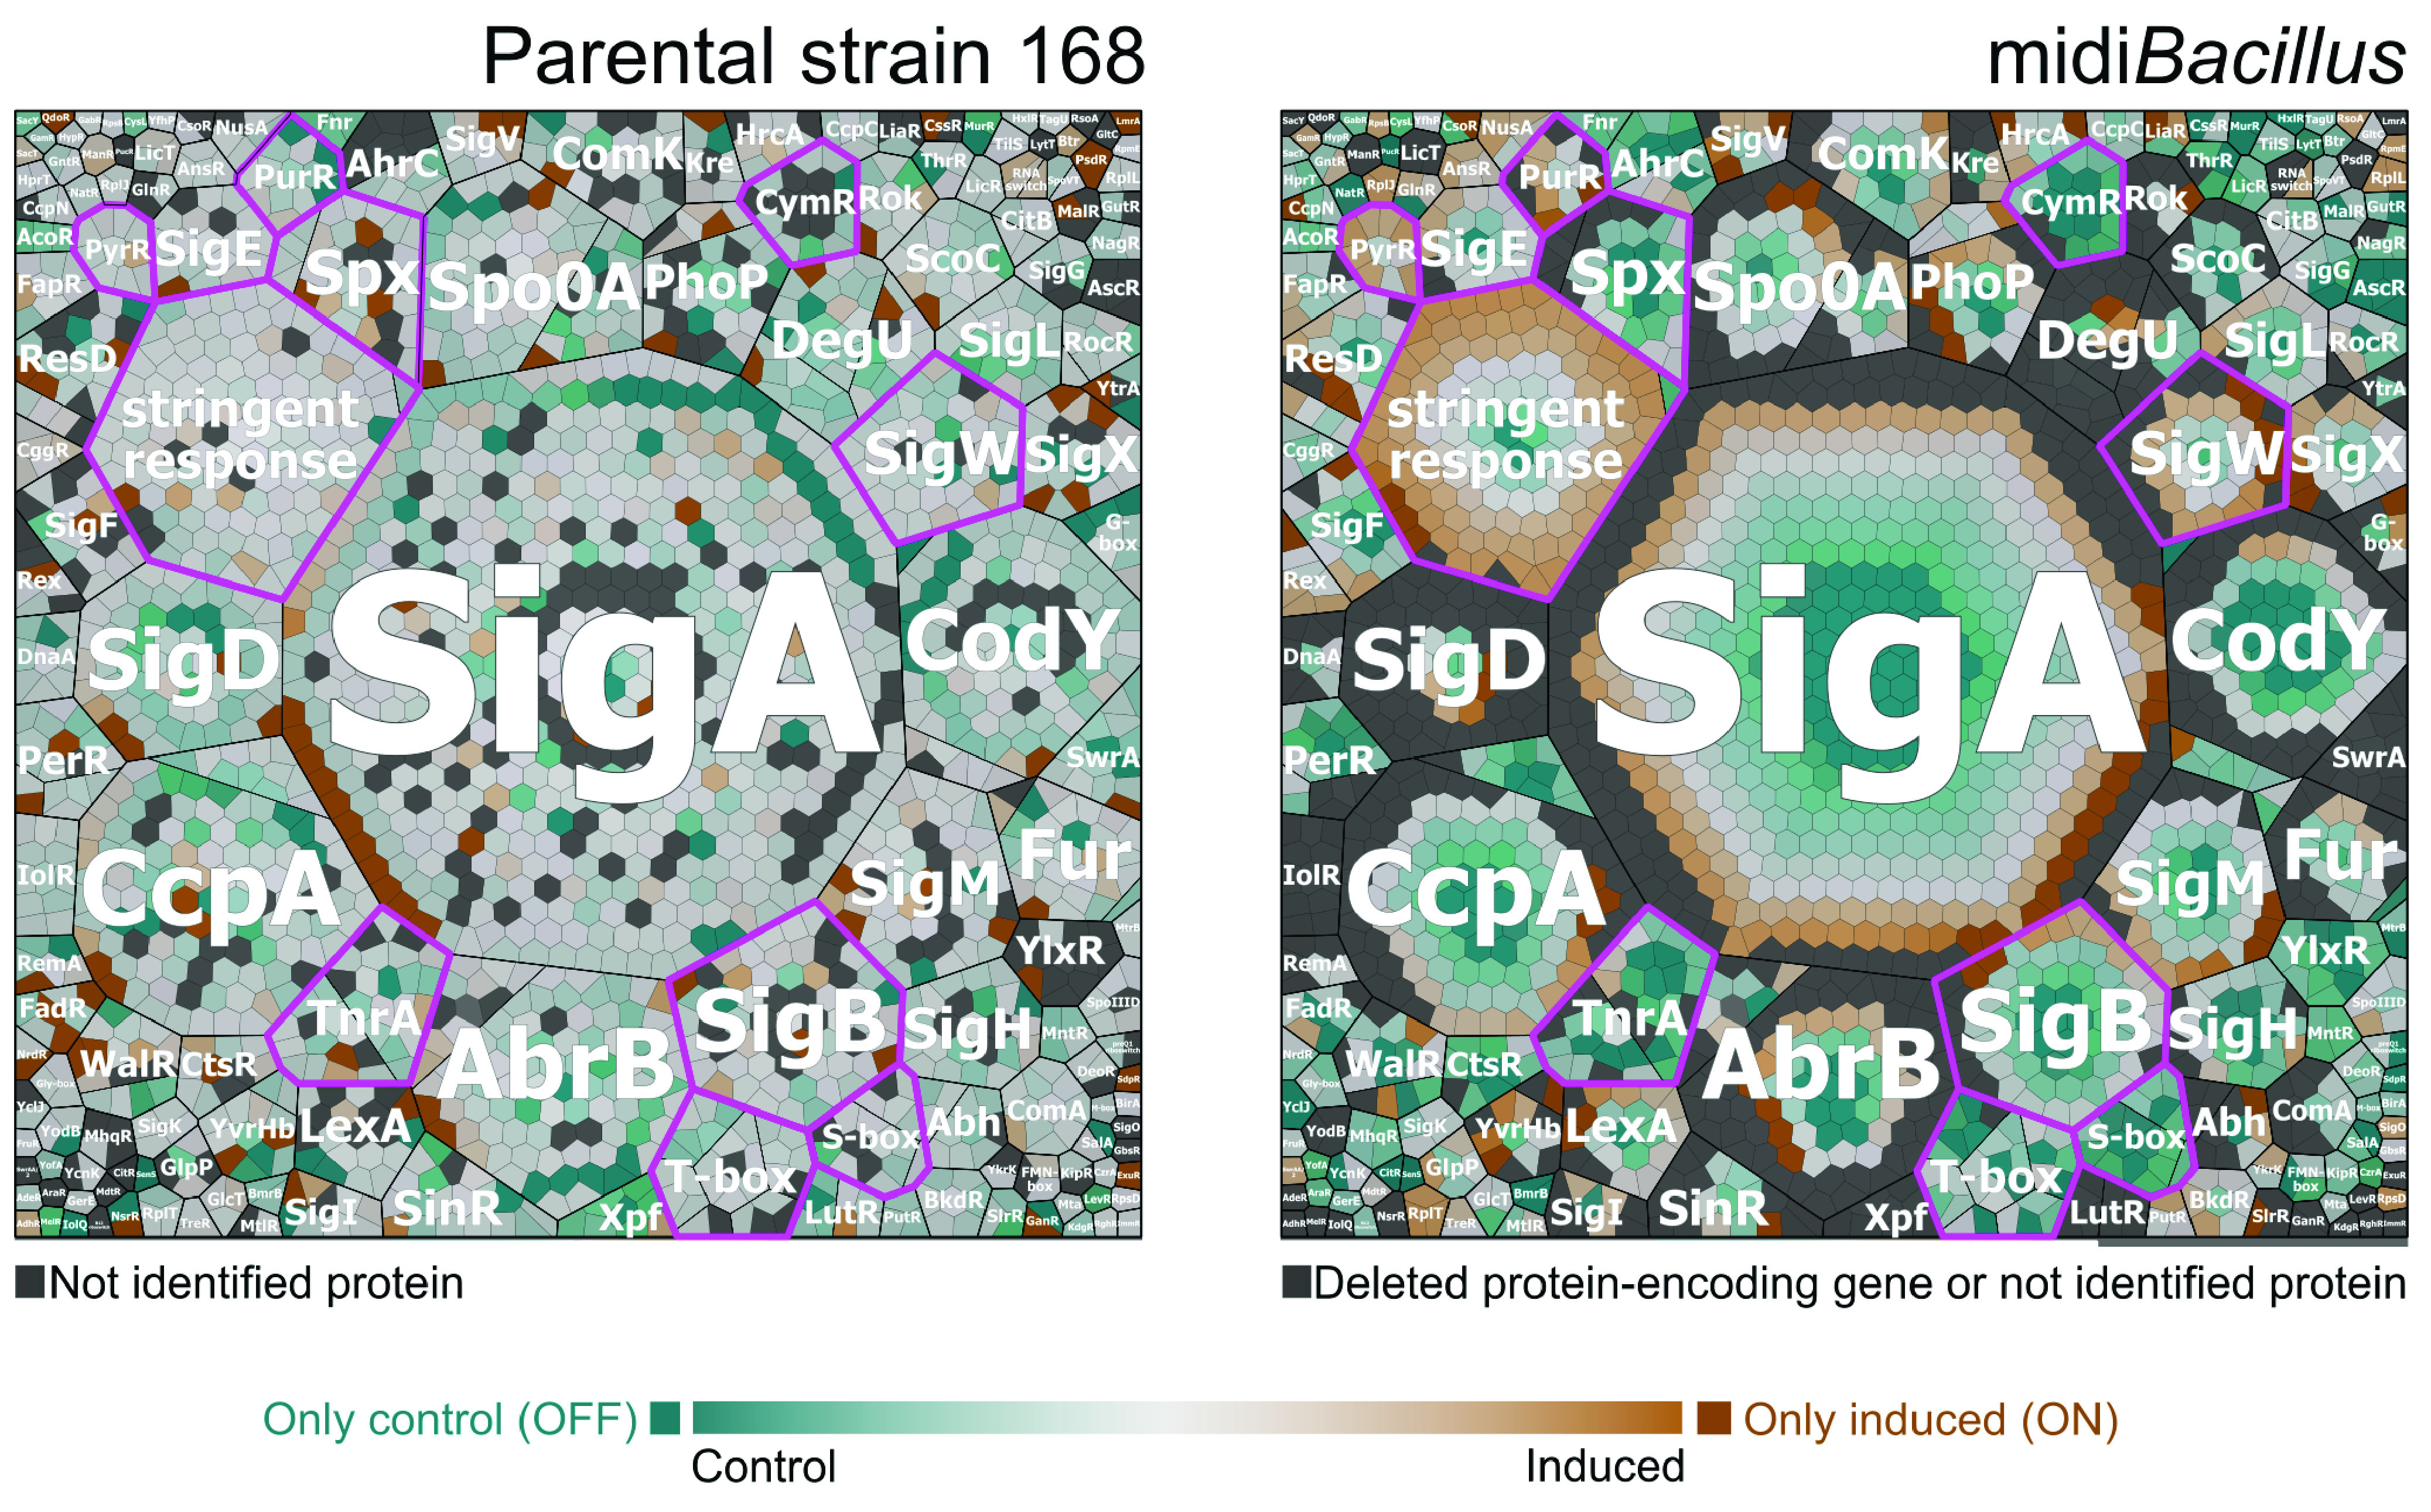
FIG 9.

Voronoi treemaps showing the quantified proteins in the parental strain 168 and midiBacillus grouped per regulon. Proteins of B. subtilis 168 (left) and midiBacillus (right) with altered abundance upon IsaA induction were grouped per regulon. The ratio of protein expression under the induced condition versus the noninduced conditions is presented in color code. Proteins colored in shades of orange are more abundant under the induced condition, and proteins colored in shades of turquoise are more abundant under the control condition. Furthermore, darker colors illustrate larger differences in protein expression. ON proteins (colored in dark orange) are present only under the induced condition, while OFF proteins (colored in dark turquoise) are present only under the control condition. Nonidentified proteins and proteins encoded by deleted genes are indicated in light gray. Regulons of interest are highlighted by fuchsia-colored outlines.
