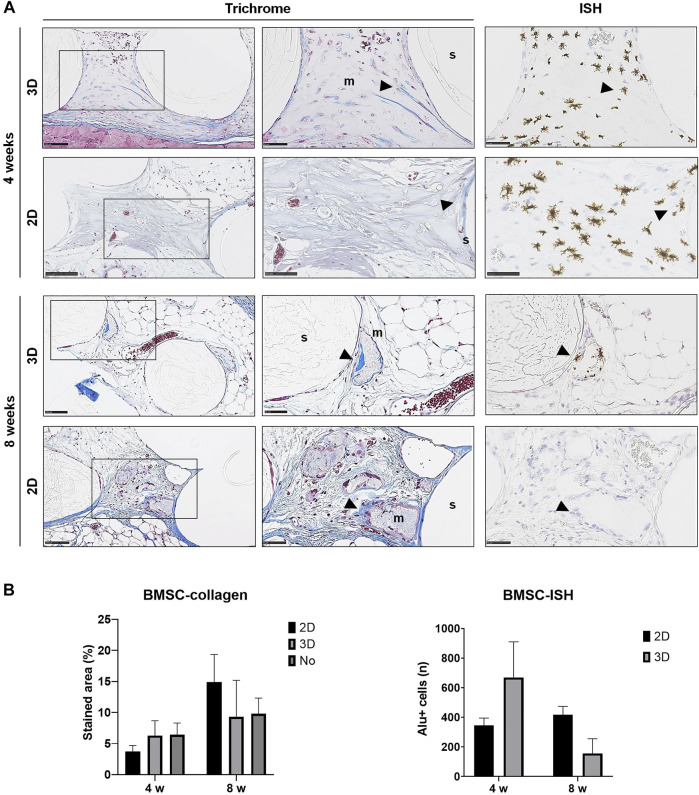
FIGURE 4.
Histology of BMSC constructs. (A) Representative images of Trichrome and corresponding ISH stained sections of 2D and 3D BMSC constructs after 4 and 8 weeks; m, mineralization; s, scaffold; wb, woven bone; arrows indicate dense collagen (Trichrome) and Alu + cells (ISH)—except in the ISH section of 2D-GPC at 8 weeks where dense collagen does not correlate with Alu + cells in ISH; scale bars 100 μm. (B) Quantification of collagen staining (Trichrome) and Alu + cells (ISH); n, total number; data represent means ± SD (n = 3).

