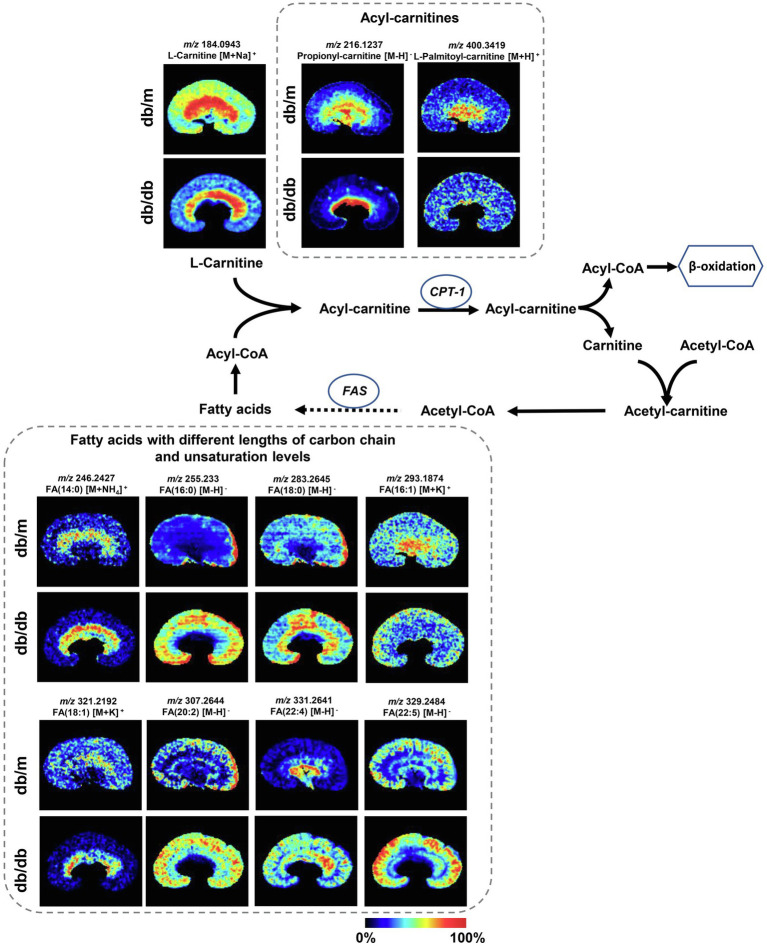
Figure 5.
Mass spectrometry images of discriminating metabolites involved in the disturbance of fatty acid degradation pathway and biosynthesis of fatty acids pathway. The blue ellipses represent rate-limiting enzymes that regulate certain metabolic pathways. FA, fatty acid; CPT1, carnitine O-palmitoyl-transferase 1; and FAS, fatty acid synthase.

