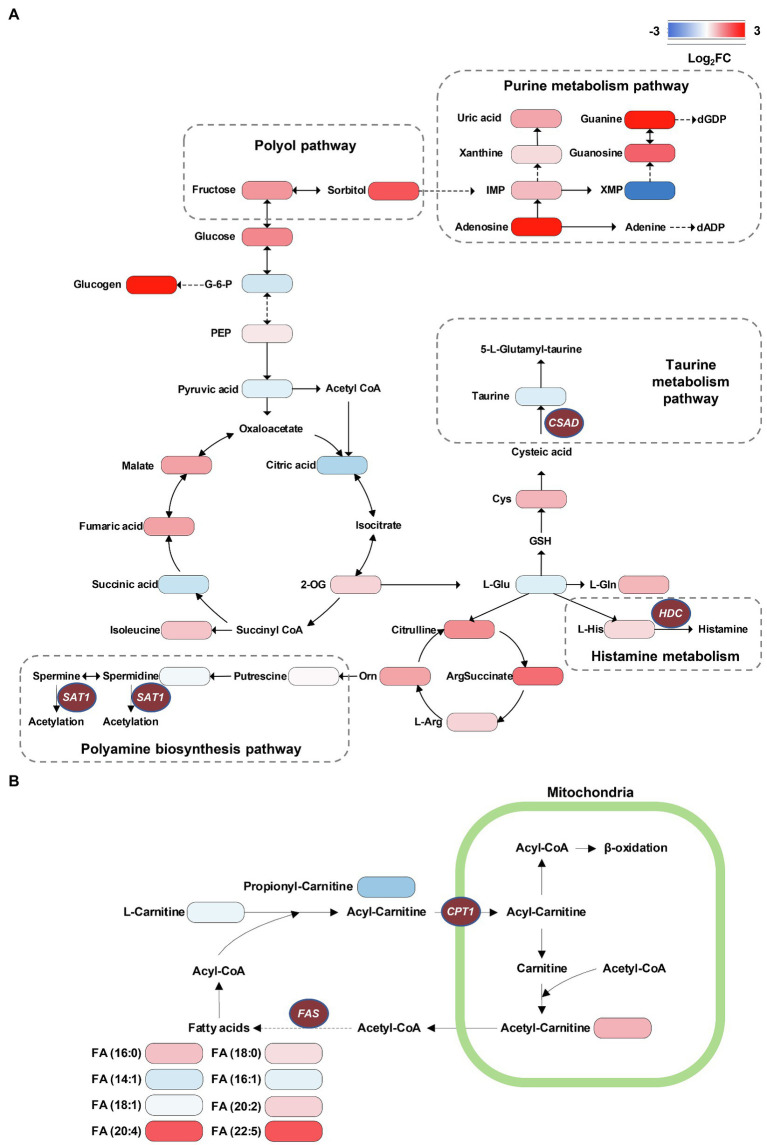
Figure 7.
Visualization of metabolome data on the energy metabolic pathway map. (A) Accumulation of TCA cycle metabolites, taurine consumption, spermidine consumption, accumulation of polyol pathway metabolites, and accumulation of purine metabolism pathway metabolites can be recognized in db/db compared with db/m mice. (B) The alternations of long-chain saturated and polyunsaturated fatty acids are presented. The brown ellipses represent rate-limiting enzymes that regulate specific metabolic pathways. G-6-P, glucose-6-phosphate; PEP, phosphoenolpyruvate; 2-OG, oxoglutarate; IMP, inosinic acid; XMP, xanthylic acid; dGDP, 2'-deoxyguanosine 5'-diphosphate; dADP, 2'-deoxyadenosine 5'-diphosphate; L-Gln, L-glutamine; L-Glu, L-glutamate; GSH, glutathione; Cys, cysteine; L-Arg, L-arginine; Orn, ornithine; HDC, histidine decarboxylase; CPT1, carnitine O-palmitoyl-transferase 1; FAS, fatty acid synthase; SAT1, Spermidine/spermine N1-acetyl transferase 1; and CSAD, sulfinoalanine decarboxylase.

