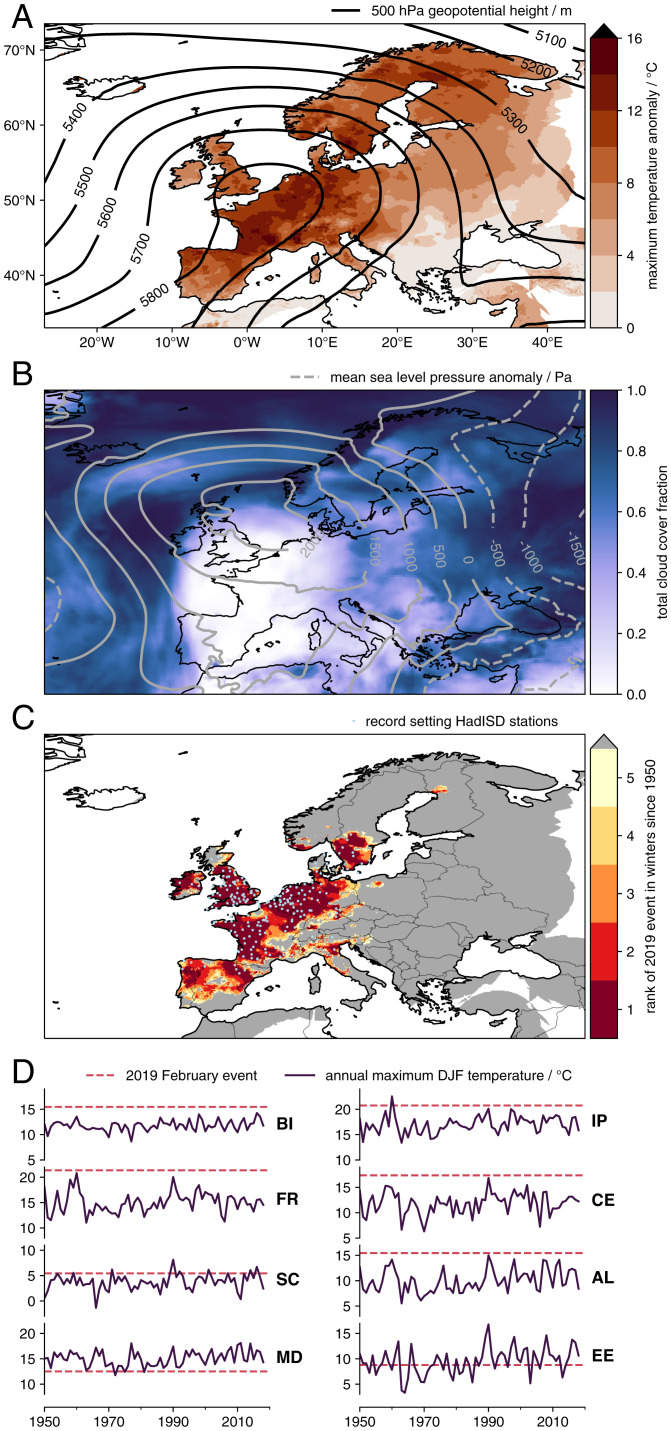
Fig. 1.
Observations and historical context of the February 2019 heatwave. (A) Maximum temperature anomaly in E-OBS with overlying contours of mean Z500 anomaly from ERA5 (61) over 25 to 27 February 2019. (B) Mean total cloud cover with overlying contours of mean sea level pressure anomaly averaged over 25 to 27 February 2019. (C) Rank of the maximum temperature in E-OBS over 25 to 27 February 2019 out of all winter temperature maxima since 1950 and light-blue scatterplot of 216 HadISD stations (with > 30 winters of measurements) that recorded their highest recorded value over the same 3 d. (D) Historical winter maximum regional mean daily maximum temperatures in E-OBS. Solid purple line shows timeseries of winter maxima for 1950 to 2018; dashed pink line indicates maximum value observed over 25 to 27 February 2019. Regions are as in ref. 27.

