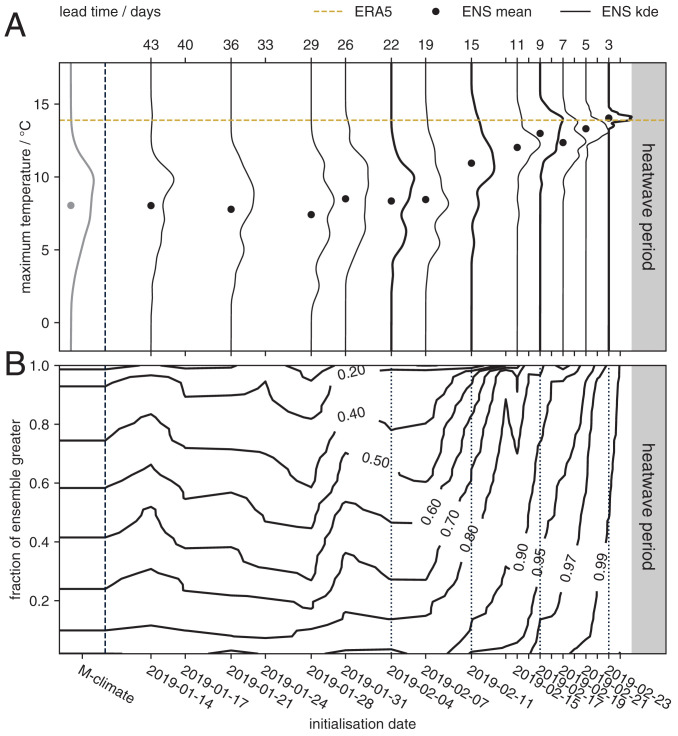
Fig. 2.
Medium- to extended-range forecasts of the heatwave. (A) Ensemble distribution of heatwave as event definition against forecast initialization date for the British Isles region. Gray line on far left shows model climatology, thick black lines show lead times selected for the perturbed CO2 experiments, dashed gold line shows heatwave magnitude in ERA5. Dots show ensemble mean. (B) Forecasts of Z500 over Europe during the heatwave period compared to ERA5. y axis shows the fraction of the forecast ensemble with a pattern correlation at least as great as the levels indicated by the contour lines, against forecast initialization date. Thin dotted lines show lead times selected for the perturbed CO2 experiments.

