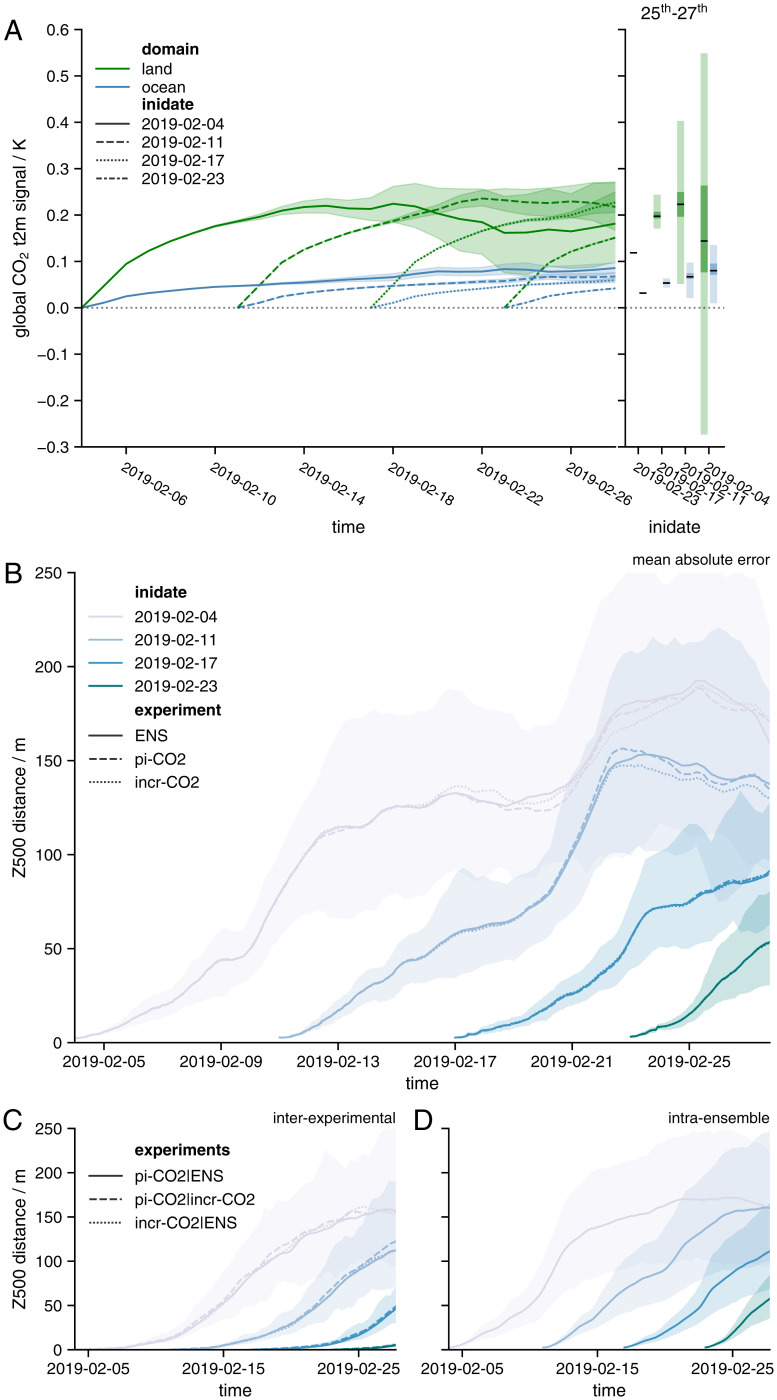
Fig. 3.
Perturbed CO2 forecast experiments. (A) CO2 signal in global mean surface temperatures. Green features show mean land temperatures and blue features show ocean. Line styles indicate initialization date of the experiments. In the boxplot of the temporal mean over 25 February 2019 to 27 February 2019, the black line shows the ensemble mean, dark shading indicates 90% confidence in the mean, and light shading indicates 90% confidence in the ensemble. (B) Mean absolute error in Z500 between experiments and ERA5. Color indicates initialization date and line style indicates experiment. Solid line indicates ensemble mean. The shading shows the 5 to 95% range from the operational ensemble (ENS). (C) As in B but for mean absolute error between corresponding ensemble members of different experiments. Line style here indicates the two different experiments. The shading shows the 5 to 95% range of the differences between the PI-CO2 and INCR-CO2 experiments. (D) As in B but for intraensemble errors. Errors here are shown only for the operational ensembles.

