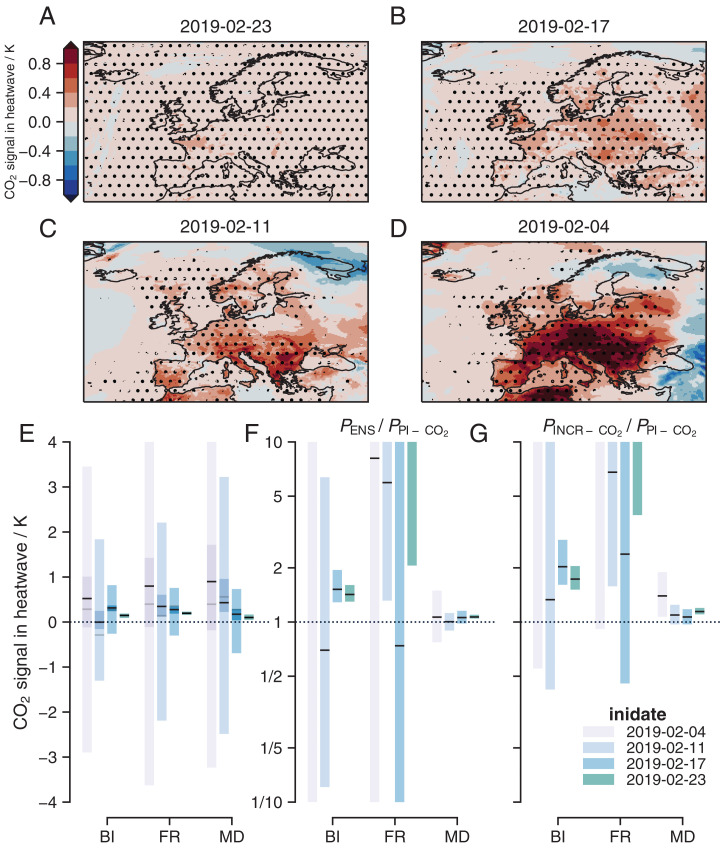
Fig. 4.
Attribution of the direct CO2 influence on the heatwave. (A–D) Maps of the ensemble mean attributable CO2 signal in the heatwave for the four forecast lead times, which are indicated by the subplot titles. Stippling indicates a significant positive signal at the 90% level. (E) Boxplot of the absolute CO2 signal for the three regions of interest and over the four forecast lead dates. Black line indicates ensemble median. Dark shading indicates 90% confidence in the median, and light shading indicates 90% confidence in the ensemble. Gray line indicates median difference between the operational forecast and PI-CO2 experiment. (F) As in E, but showing risk ratios using the operational forecast as a factual and PI-CO2 experiment as a counterfactual ensemble. (G) As in F, but using the INCR-CO2 experiment as a factual and PI-CO2 experiment as a counterfactual ensemble.

