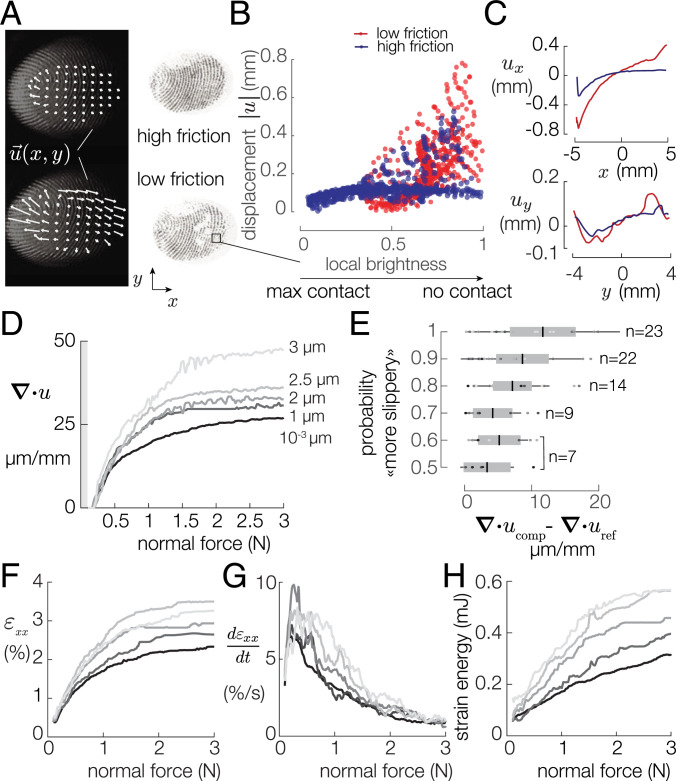
Fig. 3.
(A) Typical images of the high- and low-friction trials. (B) Displacements of a grid of points plotted against the local brightness. Displacements and local brightness are positively correlated (Spearman’s coefficient = 0.5761, P < 0.0001). (C) Displacements of this typical grid of points along the x and y axes. (D) Median divergence for each vibration amplitude. (E) The probability to answer comparison is the most slippery is plotted against the median divergence difference. Darker colors represent the smaller vibration amplitudes. (F) Median longitudinal strain for each vibration amplitude. (G) The strain-rate peaks after 0.4 N for each vibration amplitude. (H) Evolution of the strain energy for various coefficients of friction.

