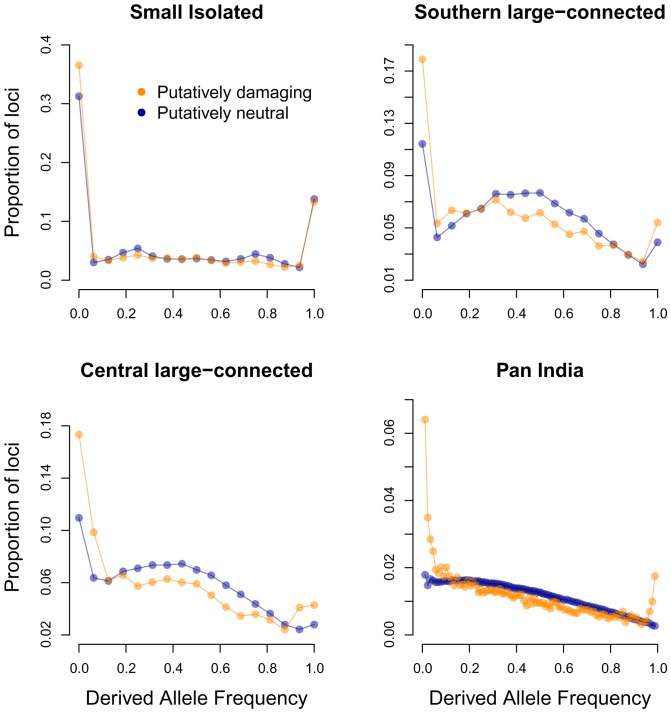
Fig. 3.
Site-frequency spectrum for damaging (missense and LOF mutations combined, orange) and neutral mutations (blue) for each population. The proportion of loci (y axis) is shown for each possible derived allele frequency (x axis). Sample sizes were equalized among the three populations by randomly subsampling 16 nonmissing alleles for each locus in each of the three populations. Fixed (frequency = 1) and missing (frequency = 0) alleles are included in the SFS for the three individual populations. We subsampled 88 nonmissing alleles at each locus to calculate the SFS for pan India to account for missing genotypes.

