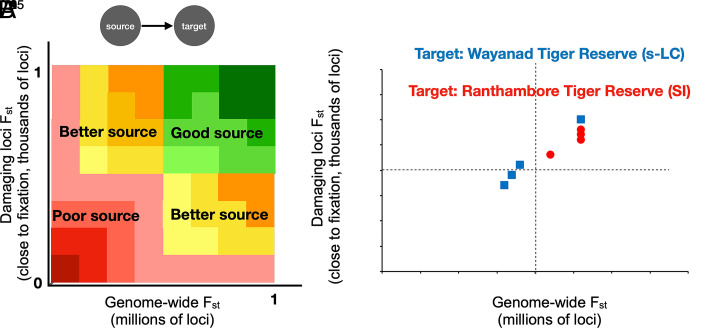
Fig. 4.
(A and B) A schematic showing the possible distribution of genome-wide FST (A) and the observed values for our data (B), assuming two target populations, Ranthambore Tiger Reserve (in red circles, the small–isolated population) and Wayanad Tiger Reserve (blue squares, a protected area within the southern large–connected population). FST on the y axis is for loci where the putatively damaging allele is at a frequency >0.9 in the target population and for all loci across the genome on the x axis.

