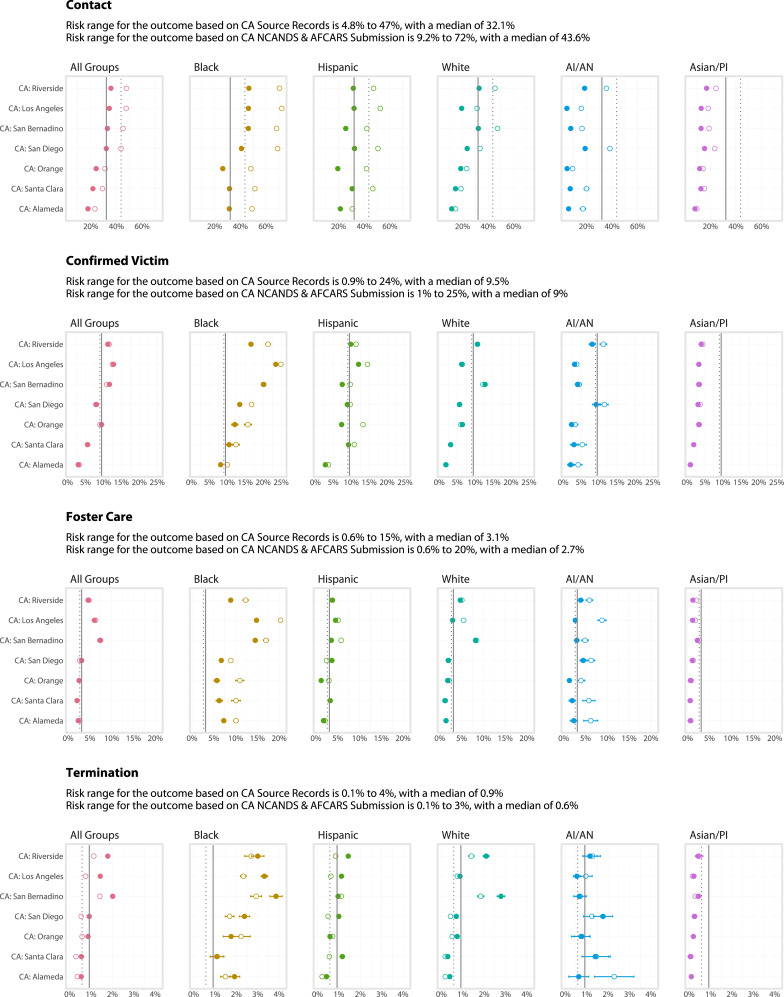
Fig. 1.
Comparison of cumulative risk estimates of CPS contact: California source records vs. Edwards et al.’s (1) estimates by race/ethnicity and county (2014–2018). California source estimates are shown as shaded dots ●; the median for all groups is depicted as a solid line. Edwards et al.’s estimates are shown as unshaded dots ○; the median for all groups is depicted as a dashed line. Counties are ordered from high to low based on overall contact. Each CPS outcome has its own x axis. The California source record analysis presented here falls under a university–agency data sharing agreement with the California Department of Social Services, which provides access to a fully longitudinal record of children’s first and subsequent CPS encounters. Importantly, the extracts of data we have access to (going back to 1998) are updated quarterly and organized into event files by the California Child Welfare Indicators Project at University of California, Berkeley. This permits us to directly observe changes to the unique identifier assigned to children and their associated encounter records over time, including records that may have been combined because of duplication or other data clean-up that may have occurred. Drawing upon these source records from California, we replicated the first encounter data structure detailed in code published by Edwards et al. We adopted their approach to coding race/ethnicity, used the same population estimates, and pulled records from the same 5-y window. We were unable to apply their imputation strategy, as that code was not publicly available. That said, the number of children with missing race/ethnicity was too low to explain the differences that emerged. We have included children with missing race/ethnicity in our overall “All Groups” estimates, consistent with the prior publication of investigations (4). AI/AN, American Indian/Alaska Native; PI, Pacific Islander.

