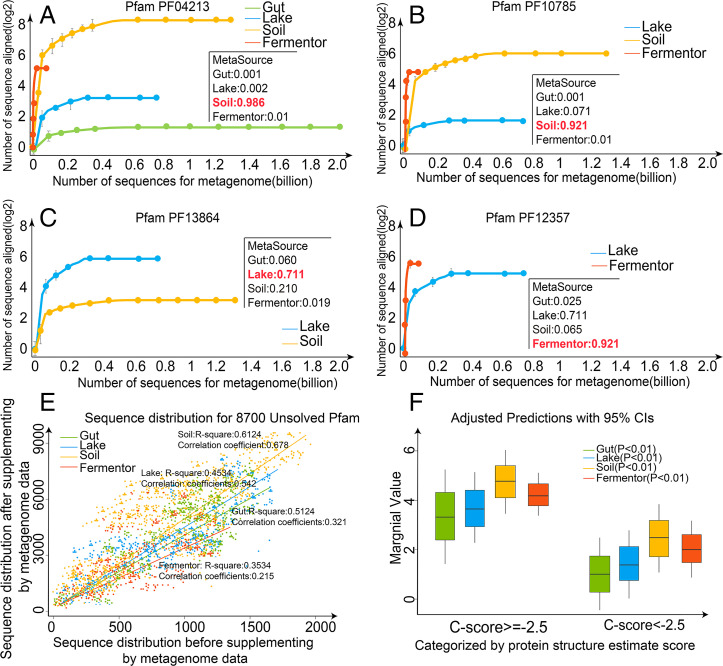
Fig. 4.
Evaluation of marginal effect for Pfam families. Collected from the four biomes, the homology sequences distribution of Pfam family (A) PF04213, (B) PF10785, (C) PF13864, and (D) PF12357 are illustrated, where the source biome of these Pfams was estimated by MetaSource. (E) The sequence distribution of metagenome data from the four biomes for all 8,700 Pfam families with unsolved structures. After the sequences from four biomes were aligned to 8,700 Pfam families with unsolved structures, respectively, the marginal effect is estimated by comparison of the number of Pfam family’s homologous sequences before and after the use of the metagenome sequences. (F) Marginal effect categorized by protein structure estimate scores.

