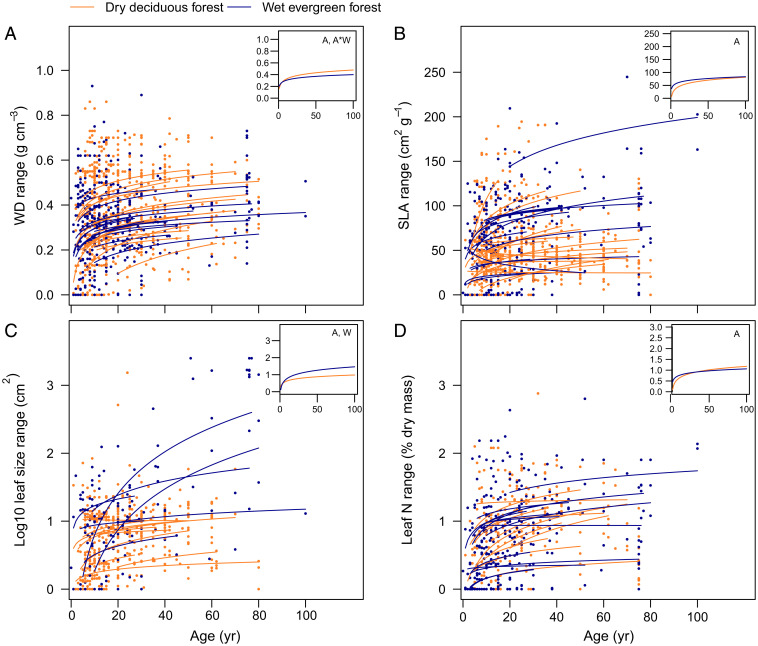
Fig. 4.
Range of trait values observed within communities versus time since abandonment. (A) WD, (B) SLA, (C) LS, and (D) LNC. The range is calculated per plot as the trait value of the 90th percentile minus the trait value of the 10th percentile of basal area–weighted trait values in a plot. Each line represents the model prediction for a different chronosequence. Lines and dots are color-coded according to the forest type as dry deciduous forest (orange) and wet evergreen forest (blue). Dots indicate individual plots. (Insets) The model prediction line for an “average” dry deciduous forest (CWA = −700 mm/y) and an “average” wet evergreen forest (CWA = −250 mm/y). Letters in Inset charts indicate whether forest age since abandonment (A), CWA (W), and their interaction (A*W) are significant.

