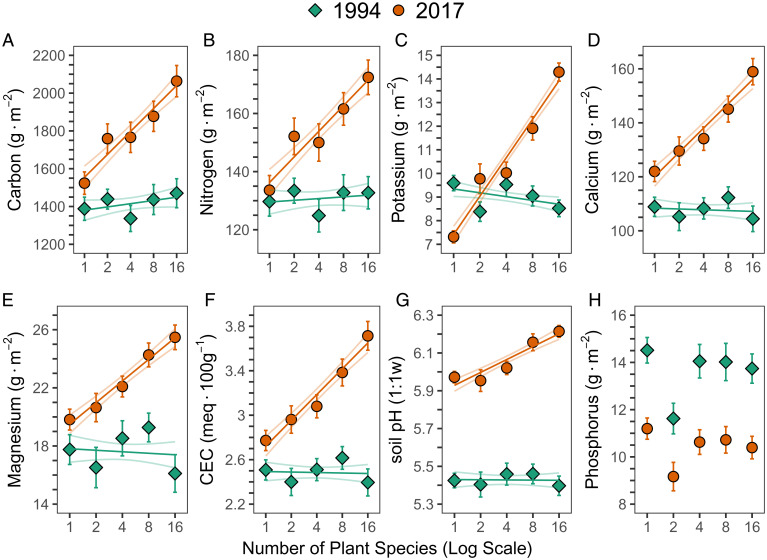
Fig. 1.
Soil chemistry vs. plant diversity. Mean ±1 SE of soil chemistry (0- to 20-cm depth) before planting in 1994 in green (diamond) and in 2017 in orange (circle) of (A) total carbon, (B) total nitrogen, (C) exchangeable potassium, (D) exchangeable calcium, (E) exchangeable magnesium, (F) CEC, (G) soil pH, and (H) extractable Bray phosphorus versus number of planted species (1, 2, 4, 8, or 16; log scale). Lines are linear regressions ± 1 SE (n = 154 plots). The quantity (grams per square meter) for C, N, P, K, Ca, and Mg were calculated using soil bulk density. Sample sizes for each diversity level (1 to 16 species) are 1 species = 32 plots; 2 = 28; 4 = 29; 8 = 30; and 16 = 35.

