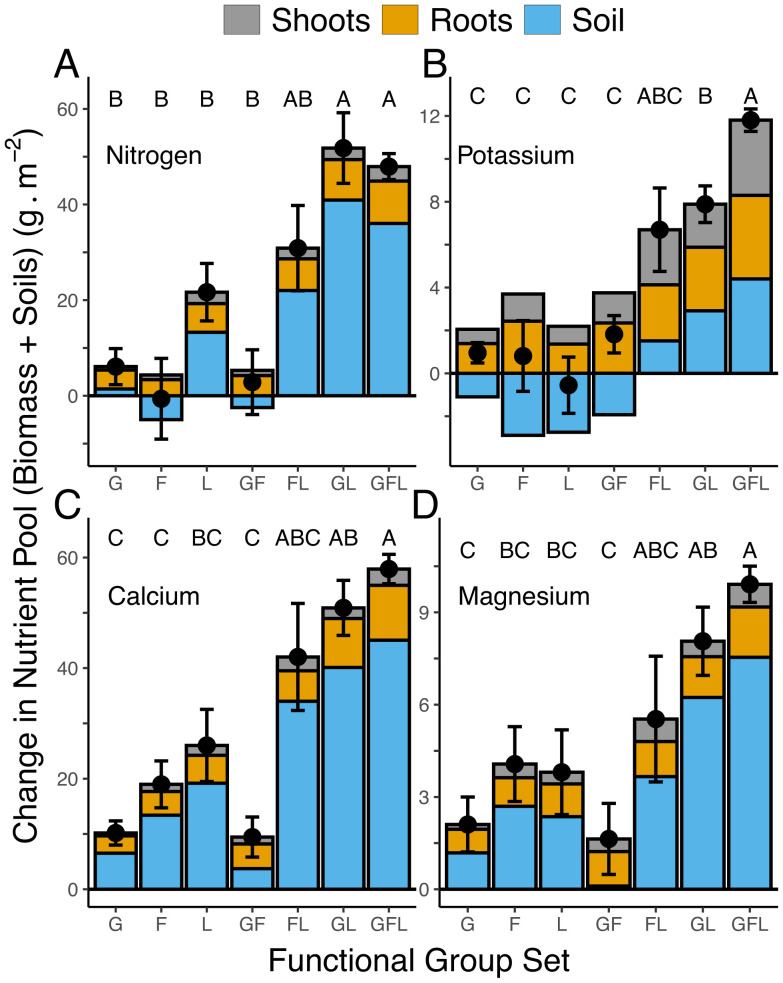
Fig. 3.
Change in ecosystem total nutrient pools (black points) for each functional group composition for (A) nitrogen, (B) potassium, (C) calcium, and (D) magnesium. Each black point shows the mean of the total ecosystem pool ± 1 SE. Pools were defined as the change from 1994 to 2017 in soil levels of a nutrient (0- to 20-cm-depth increment) plus amounts of that nutrient in aboveground biomass and in roots (0 cm to 30 cm) in 2017; sum expressed as grams of nutrient per square meter. Bars show the value for each nutrient in aboveground biomass (gray), in belowground biomass (yellow), and in soil (blue). Bars with negative values, shown below the zero line, indicate a reduction from 1994 to 2017 for an element. Functional group compositions: G = grasses only, n = 22; F = nonlegume forb only, n = 10; L = legumes only, n = 11; FL = at least one forb and one legume, n = 5; GL = at least one grass and one legume, n = 23; GF = at least one grass and one forb, n = 14; GFL = at least one grass, one legume, and one forb, n = 69. Letters indicate whether means for a particular nutrient differ (P < 0.05) following a Tukey correction.

