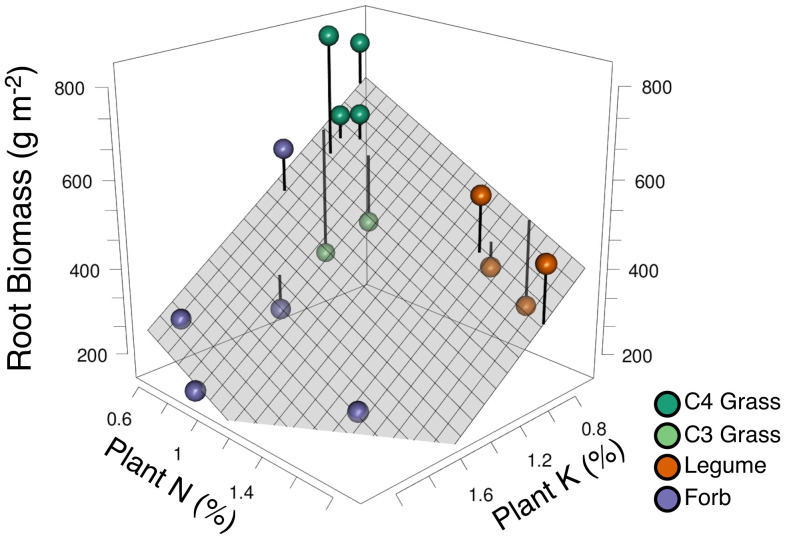
Fig. 4.
Empirical trade-off surface among plant traits for the 15 herbaceous perennial plant species that persisted in the experiment. A regression plane (F2,12 = 6.3, R2 = 0.51, P = 0.014) is fitted to species-specific measured values of percent aboveground tissue potassium (K) (x axis), percent aboveground tissue nitrogen (N) (y axis), and mean monoculture root biomass (grams per square meter; 0- to 30-cm depth; z axis). Each point represents the three measured traits of each of 15 species (SI Appendix, Table S7) classified as grasses (C4 grasses in dark green and C3 grasses in light green), forbs (purple), and legumes (orange). The %N and %K represent the mean across each species' monocultures and the biomass of each species in five 16-species plots. Root biomass represents the mean root mass (0- to 30-cm depth) of each species' monocultures. Removing the two C3 grasses (lighter green; below the plane), which are subdominant species in this ecosystem and grew poorly in monoculture, increased the fit of the plane to F2,10 = 15, R2 = 0.75, P = 0.001 (not shown). The point for Andropogon gerardii (C4 grass) was slightly jittered in the x and y axis to avoid overplotting with Sorghastrum nutans (C4 grass).

