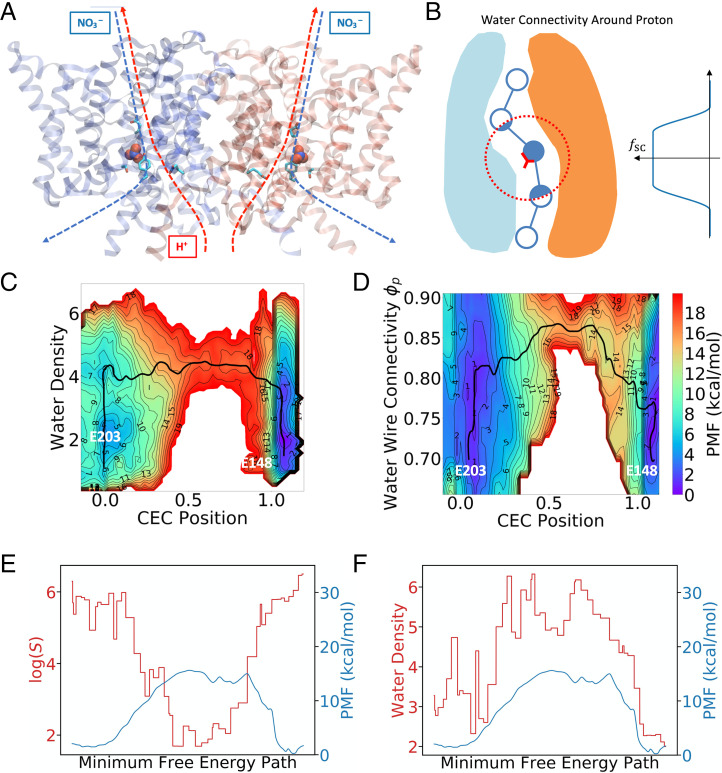
Fig. 3.
(A) Image of ClC-ec1 in the NO3−-antiporting state. Proton and anion pathways are indicated by dotted lines. (B) Illustration of how the water connectivity around the excess proton can be calculated. Note that the fictitious beads are spaced more compactly in practice, but the sparse beads here are for clarity of illustration. (C) A 2D-PMF as a function of simple water density and the hydrated excess proton CEC position (SI Appendix, Eq. S3). (D) A 2D-PMF as a function of water CV, , and the hydrated excess proton CEC position (SI Appendix, Eq. S3). The black curves show the MFEP on the 2D-PMF. (E) The shortest path CV plotted against PMF along the MFEP (same as black curve in B). (F) The water wire gap (see ref. 31 for a detailed definition) along the MFEP.

