Fig. 5.
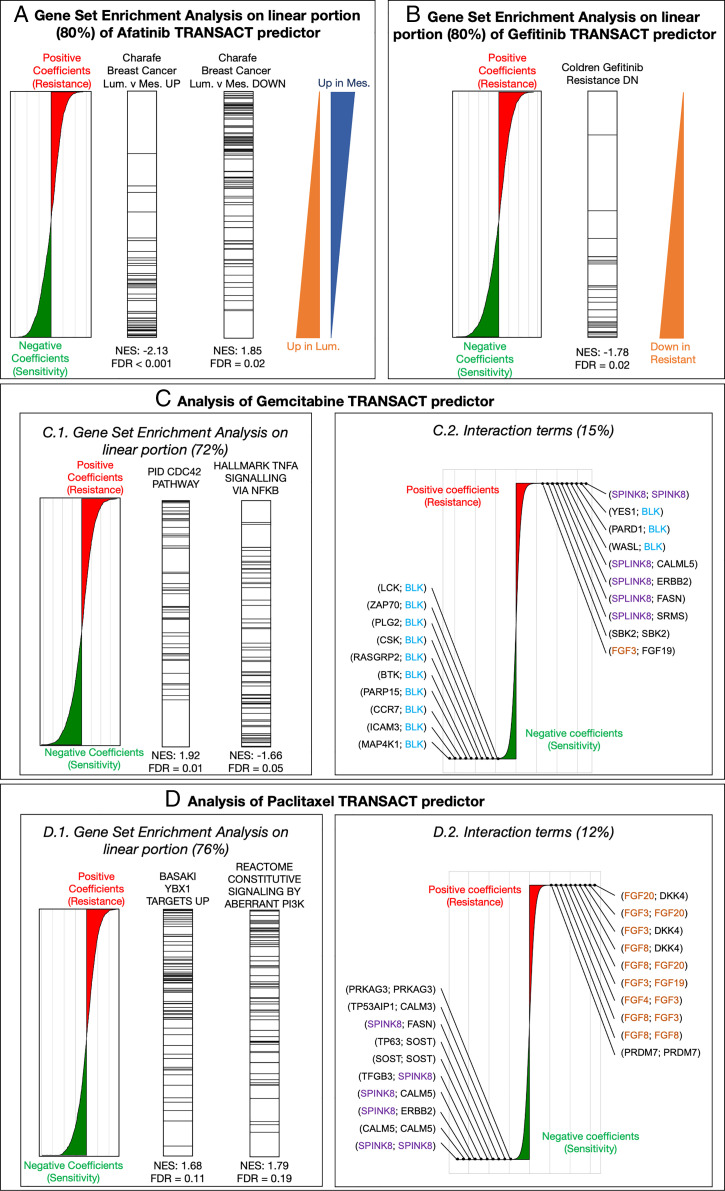
Interpretability of TRANSACT consensus features recapitulates modes of action for Afatinib and Gefitinib and highlights mechanisms of sensitivity and resistance to Gemcitabine and Paclitaxel. (A) For the Afatinib (HER-2 protein kinase inhibitor) response model trained on GDSC samples projected on GDSC-to-TCGA consensus features, we show the contribution of each gene to the predictor. (Left) Positive (negative) weights in the predictor indicate that high (low) expression of the genes leads to resistance (sensitivity) represented by larger (smaller) AUCs. We performed a PreRanked gene set enrichment analysis on these weights and highlight genes associated to two significantly enriched gene sets: “Charafe […] Luminal versus Mesenchymal UP” (Center Left) and “Charafe […] Luminal versus Mesenchymal DOWN” (Center Right). The two triangles on the right illustrate these two gene set distributions. (B) Interpretation of the linear part of the Gefitinib (EGFR inhibitor) model. We display gene weights ordered by contribution (Left) and the ranks of genes known to be down-regulated in Gefitinib-resistant tumors (Right). (C) Interpretation of Gemcitabine predictor. (Left) We display the positions of genes associated to two significantly enriched gene sets: “CDC42 pathway,” associated to positive weights (resistance), and “TNF- signaling,” associated to negative weights (sensitivity). (Right) Interaction terms make 15% of Gemcitabine predictor. We show the distribution of their weights annotated with the 10 largest weights (resistance) and 10 smallest weights (sensitivity). (D) Interpretation of Paclitaxel predictor. (Left) We display the positions of genes associated to two significantly enriched gene sets, both to resistance: “Basaki YBX1 target UP” and “constitutive signaling by PI3K-aberrant signaling.” (Right) Interaction terms for Paclitaxel that make 12% of the predictor alongside the top 10 resistant and top 10 sensitive interactions.

