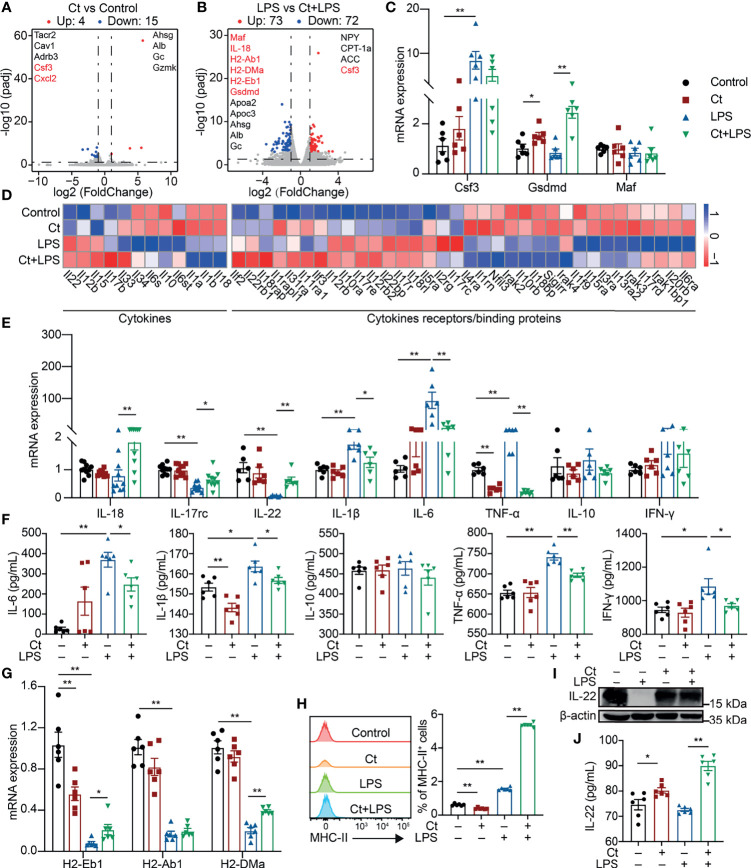
Figure 2.
Ct enhances the expression of IL-22 in response to LPS. (A) Volcano plots of differentially expressed genes between the Control and Ct group (Ct vs Control, n=6). (B) Volcano plots of differentially expressed genes between the LPS and Ct + LPS group (LPS vs Ct + LPS, n=6). (C) RT-qPCR analysis of Csf3, Gsdmd, and Maf in the ileum (n=6). (D) Heat-map of differentially expressed genes enriched in cytokines and cytokine receptors/binding proteins. (E) RT-qPCR analysis of cytokines including IL-18, IL-17rc, IL-22, IL-1β, IL-6, TNF-α, IL-10, and IFN-γ in the ileum (IL-18 and IL-17rc, n=10, others, n=6). (F) The levels of inflammatory cytokines including IL-6, IL-1β, IL-10, TNF-α, and IFN-γ in the ileum (n=6). (G) RT-qPCR analysis of MHC-II transcripts in the ileum (n=6). (H) Proportions of MHC-II+ cell in the ileum (n=6). (I) Immunoblotting analysis of IL-22 in the ileum. (J) ELISA analysis of IL-22 levels in the ileum (n=6). Data were presented as mean ± SEM. The significant difference was analyzed by two-way unpaired t-tests. *P < 0.05, **P < 0.01.

