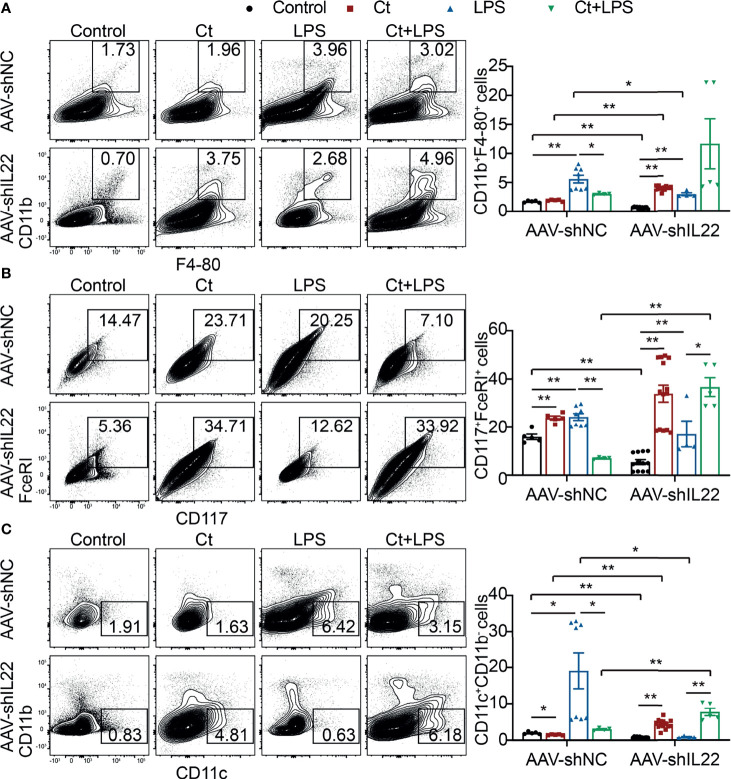
Figure 4.
Effects of Ct on the proportions of macrophages, mast cells, and DCs in the ileum. Flow cytometric analyses were conducted on 8-colour FACS Verse and three panels were used to analyzing the intestinal immune cells. The single cells were first gated on SSC-A vs FSC-A and FSC-A vs FSC-H, and then CD45+FVS780- cells (CD45+Live+ cells) were gated out. CD11b+F4-80+ cells, CD117+FceRI+ cells, and CD11c+CD11b- cells were gated out from CD45+Live+ cells. (A) Proportions of macrophages (CD11b+F4-80+ cells). (B) Proportions of mast cells (CD117+FceRI+ cells). (C) Proportions of DCs (CD11c+CD11b- cells). Each point presented a mouse. Data were presented as mean ± SEM. The significant difference was analyzed by two-way unpaired t-tests. *P < 0.05, **P < 0.01.

