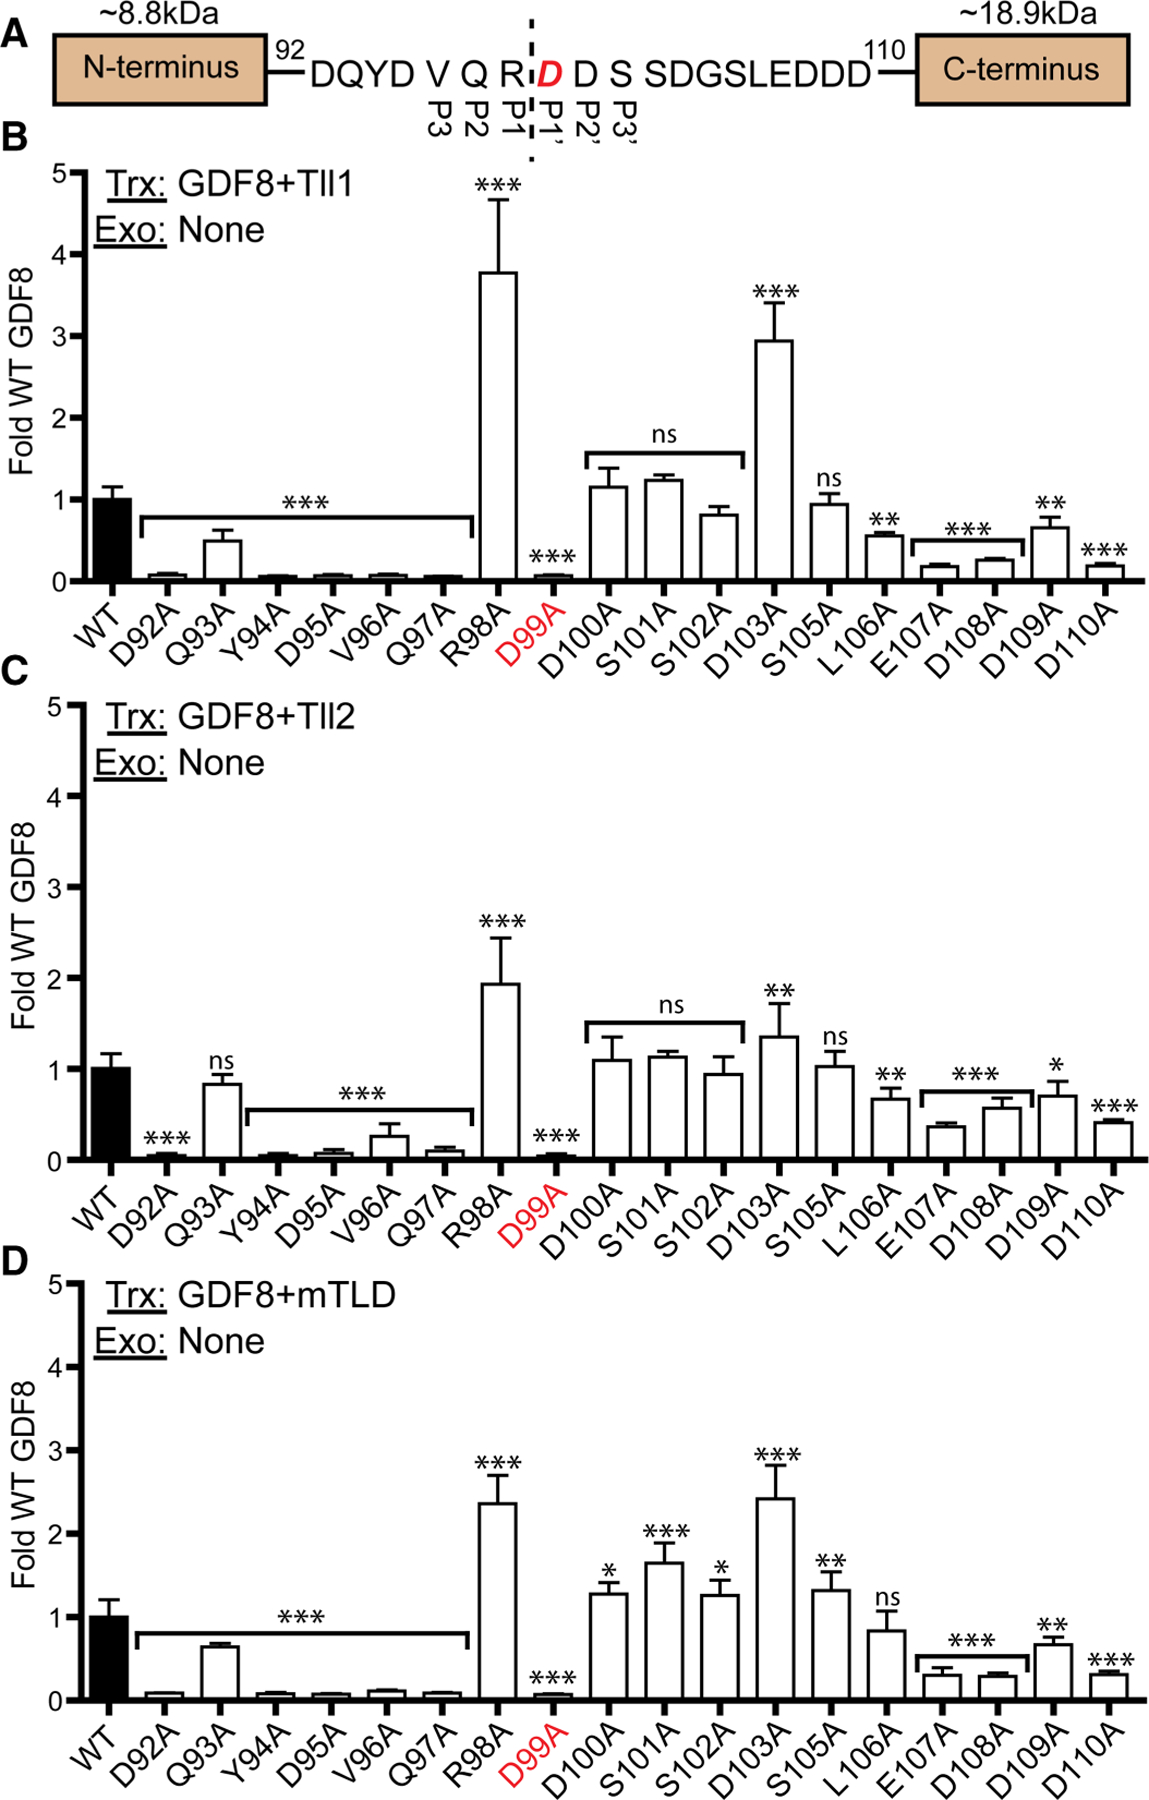
Figure 2. Transfection-based luciferase of GDF8 alanine screen.

(A) Sequence of the GDF8 tolloid cut site with P3–P3′ residues denoted, and the essential D99 residue shown in red. (B) 100 ng of GDF8 WT or mutant DNA transfected with 50 ng of furin and Tll1 DNA. (C) Similar to (B) but with Tll2 DNA transfected. (D) Similar to (B,C) with mTLD DNA transfected. The DNA transfected (Trx) and exogenous (Exo) protein added (if applicable) is denoted in the top left each graph. Data plotted as mean ± SD and were conducted at least three times with experimental triplicate. Bar graphs were compared using one-way ANOVA with Bonferroni correction against WT GDF8 (*P < 0.05, **P < 0.01, ***P < 0.001).
