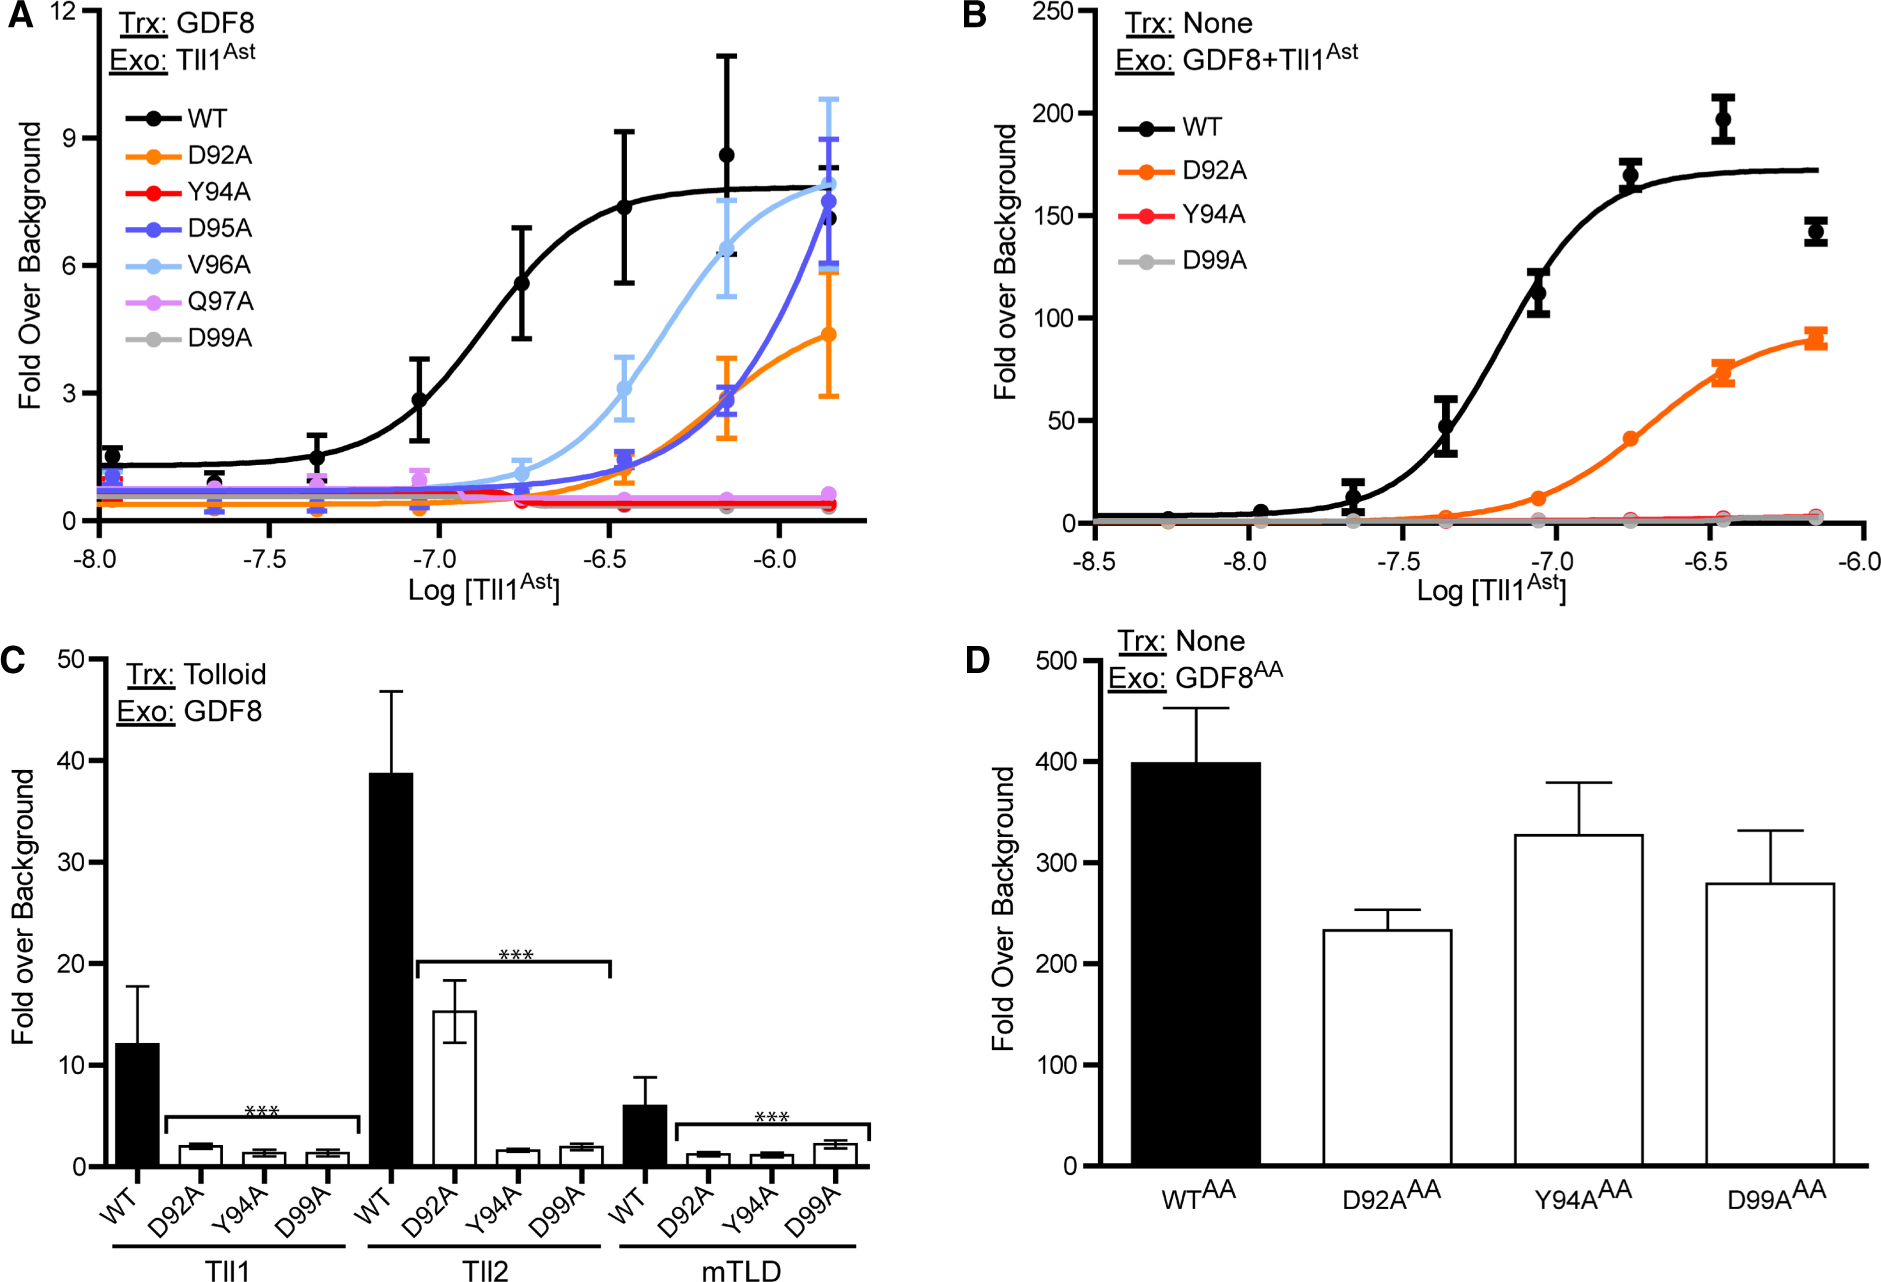
Figure 5. Analysis of fully latent GDF8 mutants.

(A) 100 ng of GDF8 DNA and 50 ng Furin DNA were transfected into HEK293T (CAGA)12 cells and treated with a 1 : 2 serial dilution of the Tll1 astacin domain. (B) 0.62 nM of purified GDF8 procomplexes treated with a serial dilution of the Tll1 astacin domain, similar to (A) and added to HEK293T (CAGA)12 cells. Data from (A) and (B) were fit by non-linear regression with a variable slope to generate EC50 curves. (C) Transfection based luciferase assay were full-length Tll1, Tll2 or mTLD were transfected into (CAGA)12 cells. Cells were then treated with 0.62 nM of purified GDF8 procomplex. Bar graphs were compared using one-way ANOVA with Bonferroni correction against WT GDF8 (*P < 0.05, **P < 0.01, ***P < 0.001). (D) 20 nM GDF8 procomplex was acid activated by adding HCl and neutralized by NaOH addition. The acid-activated (AA) procomplex was then added to (CAGA)12 cells and plotted as fold-over serum-free background. The DNA transfected (Trx) and exogenous (Exo) protein added (if applicable) are denoted in the top left of each graph. Experiments were conducted at least three times with experimental triplicate and plotted as mean ± SD.
