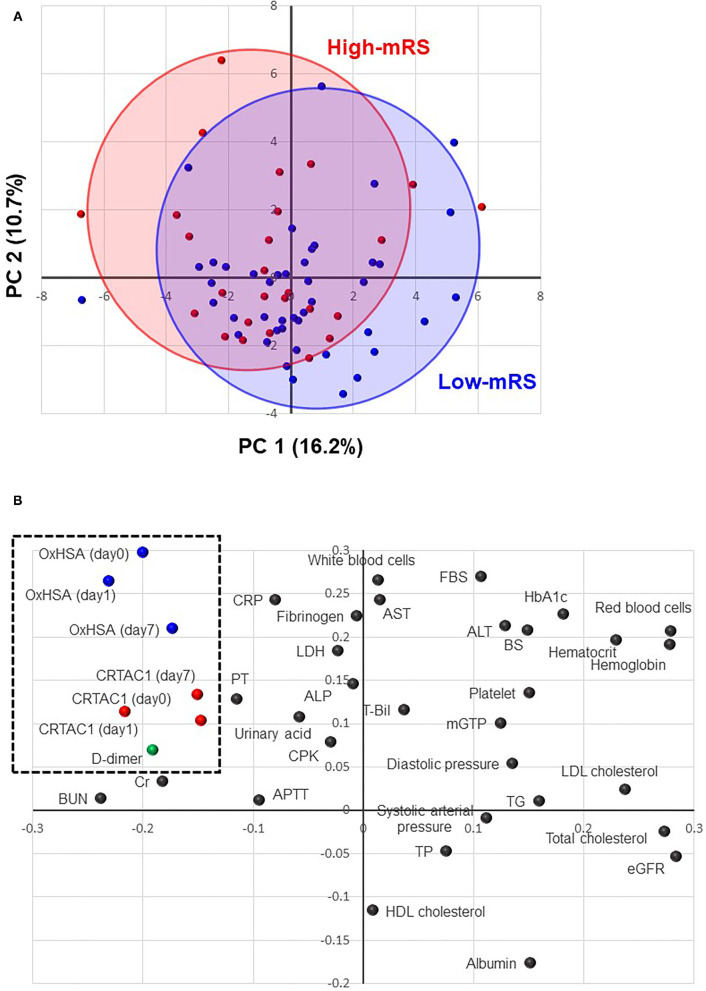
Figure 2.
Principal component analysis (PCA). (A) A score plot of the first and second components of PCA analysis. Red solid circles indicate high-mRS patients, and the red oval shows the distribution of the high-mRS group. Blue solid circles indicate low-mRS patients, and the blue oval shows the distribution of the low-mRS group. (B) A loading plot of the first and second PCA components: each dot represents biomarkers, such as %OxHSA, CRTAC1, and laboratory test results. The biomarkers located in the upper-left corner (enclosed with a dotted-line square) are elevated in the high-mRS group. mRS, modified Rankin scale; OxHSA, oxidized albumin; CRTAC1, cartilage acidic protein-1.

