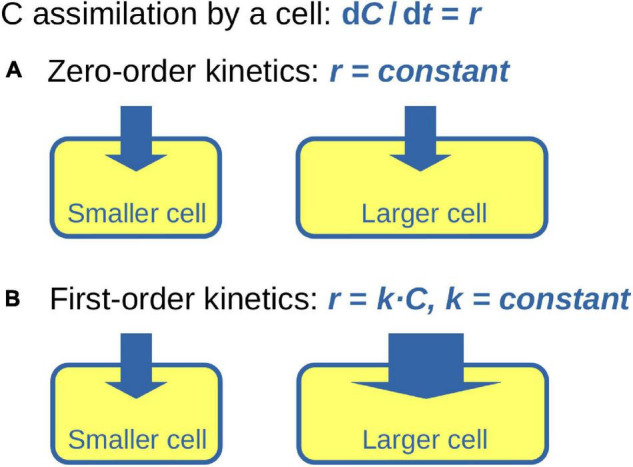
FIGURE 1.

Conceptual diagram of C assimilation during cell growth. Cell is represented by a rectangle with round edges. Size of the rectangle represents C content of the cell, thickness of the arrow entering the cell represents the cell-specific rate of C assimilation, r. (A) Zero-order kinetics of C assimilation assumes that r is independent of the cellular C content. (B) First-order kinetics of C assimilation assumes that r increases proportionally to the instantaneous cellular C content.
