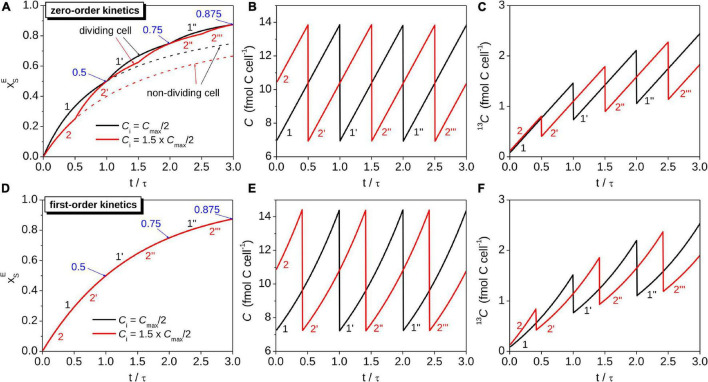
FIGURE 2.
Simulations of the time-dependence of the isotopic composition and C content in cells assimilating C according to different models. Shown are the source-normalized excess 13C atom fraction (panels A,D), total C content (panels B,E), and 13C content (panels C,F) for two cells with different initial C contents (Ci = Cmax/2 for cell 1, Ci = 1.5⋅Cmax/2 for cell 2). Note that cells divide when their total C content reaches Cmax. For comparison, results calculated based on a model that ignores cell division are shown by dashed lines in panel (A). The number of primes behind the digit 1 and 2 indicates the generation of the daughter cells corresponding to the original mother cells. The cells assimilating C with zero-order kinetics had equal cell-specific C assimilation rates, r, while the cells assimilating C with first-order kinetics had equal carbon-specific C assimilation rates, k. These rates were related as k = r/⟨C⟩, where ⟨C⟩ was the same for both cell types. In all panels the time was normalized by the doubling time τ, calculated as τ = Cmax/(2⋅r) and τ = ln(2)/k for the cells assimilating C with zero-order and first-order kinetics, respectively. Blue arrows with numbers at t = n⋅τ indicate , where n = 1, 2, etc. Simulations were performed for xi = 0.011 and for hypothetical values of xS,eff = 0.2, ⟨C⟩ = 10 fmol C cell–1 and r = 1.35 fmol C cell–1 h–1. These values correspond to k = 0.135 h–1, τ≈ 5.1 h, and Cmax ≈ 13.9 and 14.4 fmol C cell–1 for the cells assimilating C with zero-order and first-order kinetics, respectively.

