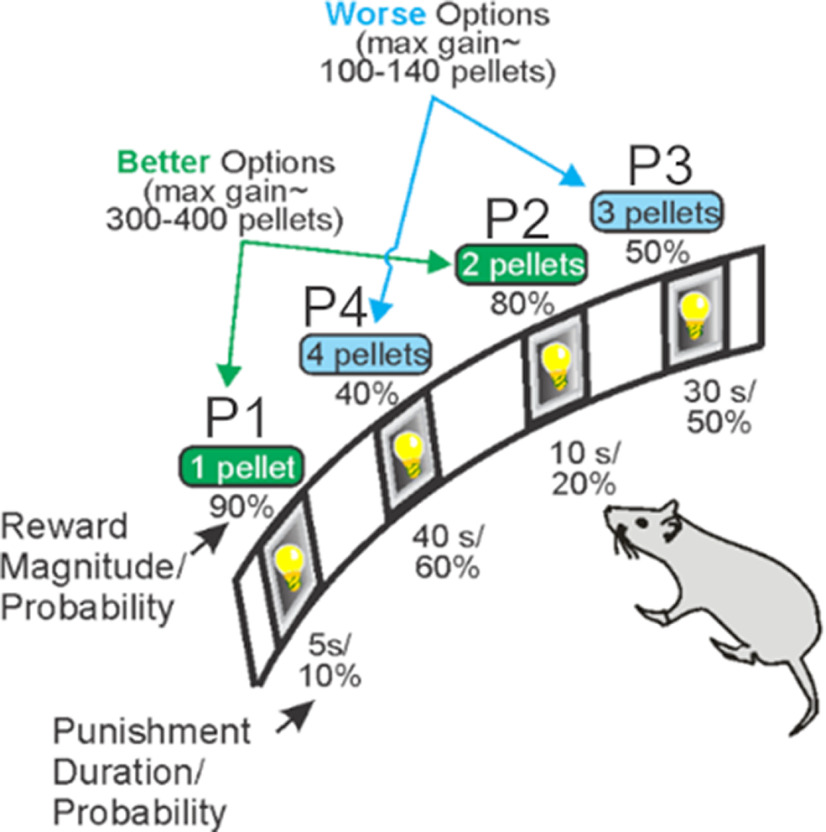
Figure 1.
Task schematic of the crGT. A nose poke response in the food tray extinguished the traylight and initiated a new trial. After an ITI of 5 s, four stimulus lights were turned on in holes 1, 2, 4, and 5, each of which was associated with a different number of sugar pellets. The order of the options from left to right was counter-balanced within each cohort to avoid development of a simple side bias [version A (shown): P1, P4, P3, P2; version B: P4, P1, P3, P2]. The animal was required to respond at a hole within 10 s. This response was then rewarded or punished depending on the reinforcement schedule for that option. Reward delivery was accompanied by a 2-s audiovisual cue that increased in complexity with reward magnitude. If the animal lost, the stimulus light in the chosen hole flashed at a frequency of 0.5 Hz for the duration of the punishing time out, and all other lights were extinguished. The maximum number of pellets available per 30-min session shows that P1 and P2 are better than P3 and P4. The percent choice of the different options is one of the primary dependent variables. A score variable is also calculated, as for the IGT, to determine the overall level of risky choice as follows: [(P1 + P2) – (P3 + P4)]. Figure is modified from Barrus and Winstanley (2016).

