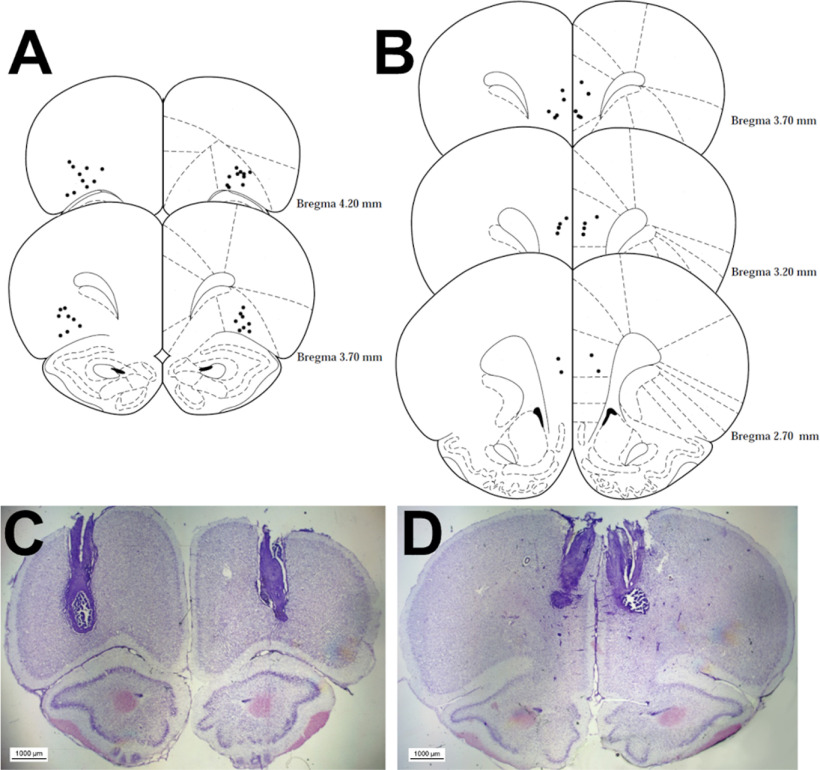
Figure 2.
Histologic analysis of cannulae implantation. Location of all acceptable lOFC (A) and PrL region (B) infusions and an example microscopy image for each region in C, D are shown. Coordinates are relative to bregma. Plates modified from Paxinos and Watson (1998).

