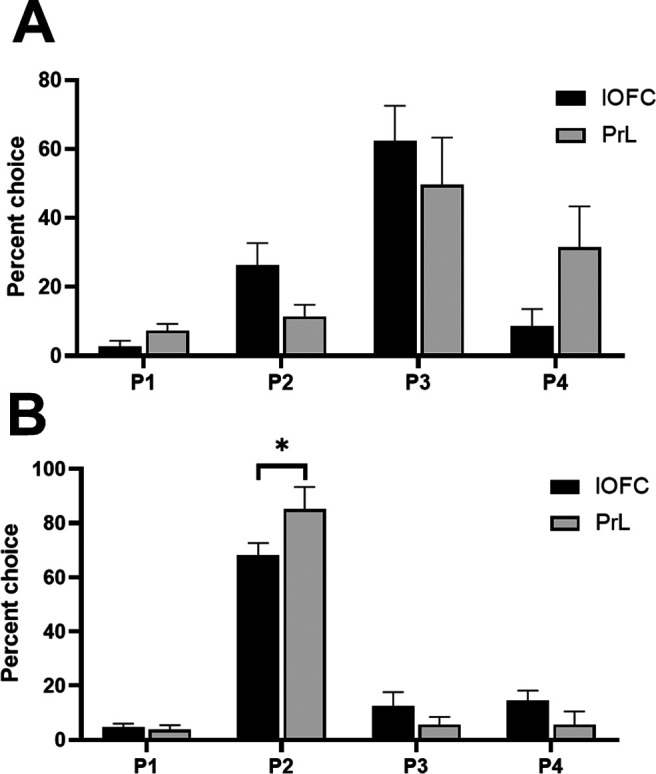
Figure 3.

Baseline preferences for each option in the lOFC and PrL cohorts in risk-preferring rats (A) and optimal decision-makers (B). Optimal rats in the PrL cohort selected P2 at a significantly higher rate than optimal rats in the lOFC cohort. Data are expressed as mean ± SEM; *p < 0.05 according to an independent-groups t test.
