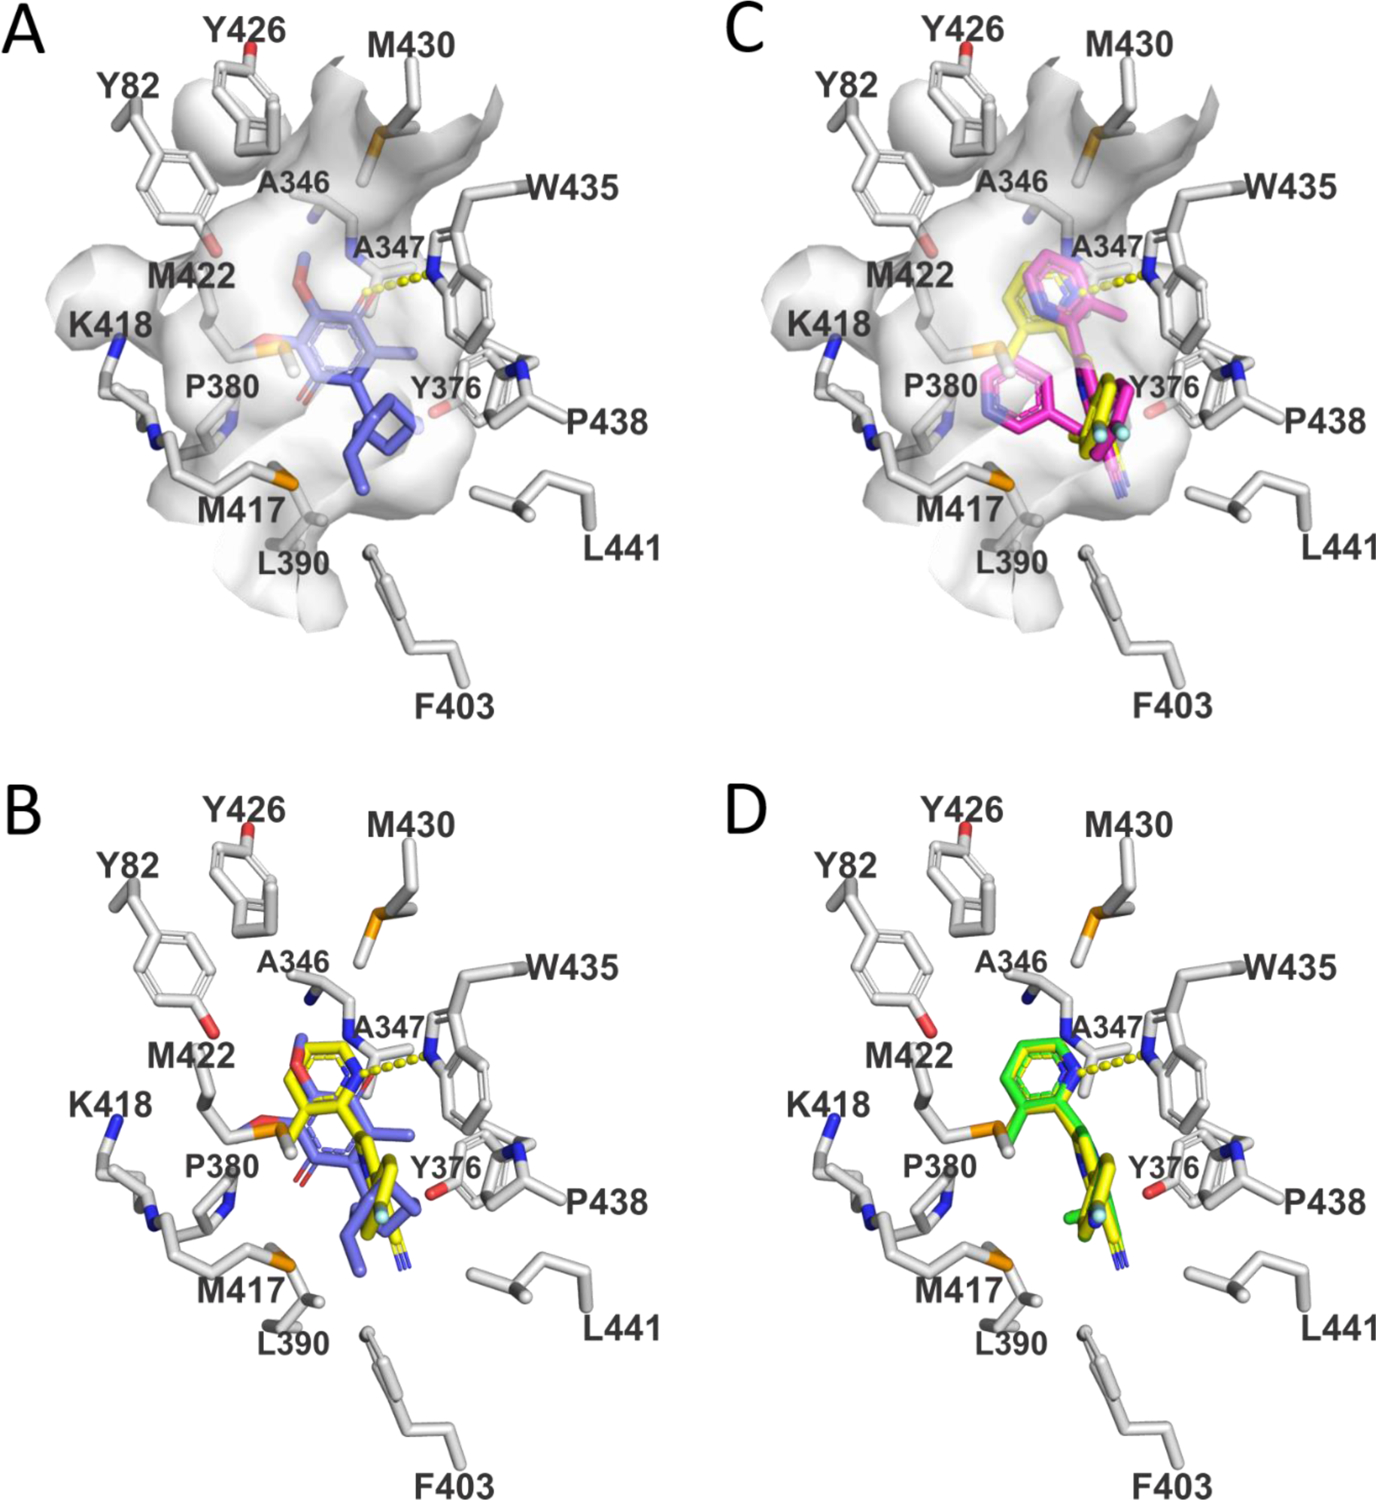
Figure 3.

Views of the CoQ-binding pocket in SQOR complexes with substrate (DCQ) or enzyme inhibitors. Carbons in amino acid side chains are colored white. Hydrogen bonds are indicated by dashed yellow lines. (A) View of the SQOR complex with DCQ (blue carbons). The surface of the CoQ-binding cavity is shown in white. The O2 carbonyl oxygen in the quinone ring of DCQ forms a hydrogen bond with W435:NE1. (B) The model of the SQOR complex with 15 (yellow carbons) was produced using GLIDE (Schrödinger) and is compared to that observed with DCQ (blue carbons). A hydrogen bond between the 2-pyridyl ring in 15 and W435:NE1 is indicated. (C) The model of the SQOR complex with 18 (magenta carbons) was produced using GOLD (Cambridge Crystallographic Data Centre) and is compared with the model of the enzyme complex with 15 (yellow carbons). The surface of the CoQ-binding cavity is shown in white. Unlike with 18, 15 forms a strong hydrogen bond to W435:NE1, as indicated by the dashed yellow line. (D) The recently reported model of the SQOR complex with 1921,22 (green carbons) was produced using GLIDE (Schrödinger) and superimposes with the preferred docking pose obtained for 15 (yellow carbons).
