7.

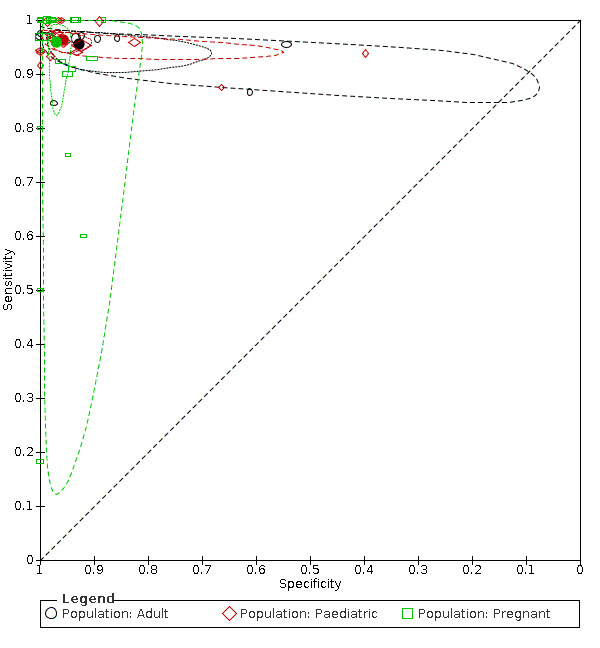
Summary ROC plot: subgroup analyses in populations of adults, children, and pregnant women. The hollow symbols represent pairs of sensitivity and specificity from included studies. The symbol size is scaled according to the sample size of the study. The solid circles represent summary sensitivity and specificity. These summary points are surrounded by a 95% confidence region (dotted line) and a 95% prediction region (interrupted line).
