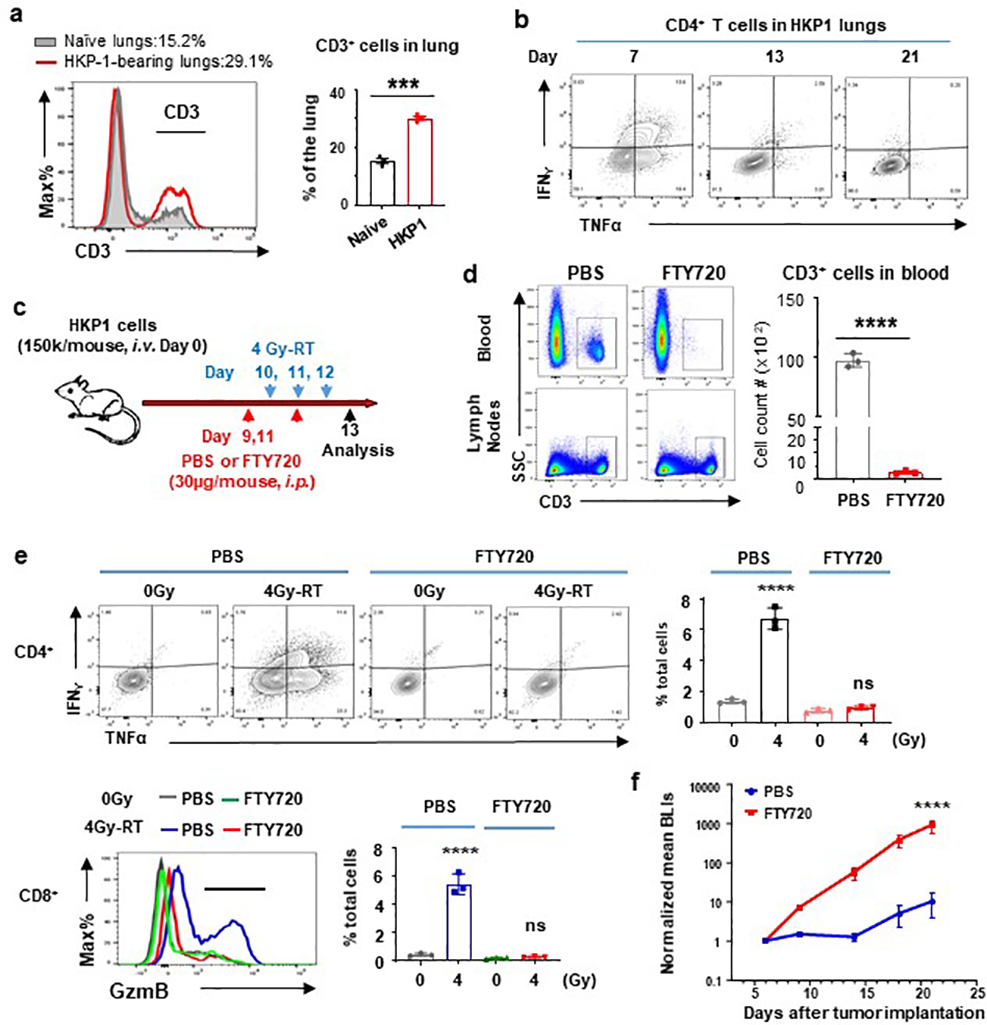
Extended Data Fig. 2. FTY720 abrogated immune-activating responses induced by 4Gy-RT.
a, Histogram plots (right) and quantitation (left) showing an increase in % CD3+ T cells in HKP1-bearing lungs in comparison to naïve lungs. Representative of n=3 individual mice b, Cytokine production (IFNγ and TNFα) by CD4+ T cells in TME at Day 7,13, and 21 after tumor implantation. Representative of n=3 lungs. c, Treatment and analysis scheme for HKP1 mice. d, Quantification of circulating T cells. Blood samples were obtained via submandibular bleeding, and lymph nodes collected from same mice served as controls. Cell counts/100,000 single flow events. Representative of n=3 mice. Unpaired two-tailed Student t test, ****P< 0.0001. e, Flow cytometric analyses of cytokine productions by T cells. Right, representative flow cytometric plots/histogram. Left, quantitation of % cytokine+ T cells in the HKP1 lungs. Representative of n=3 lungs. One-way ANOVA with Sidak multicomparison, ****P< 0.0001. f, Tumor growth curves of mouse cohorts treated with PBS or FTY720 as indicated. All the mice (n=5) in f were also received 4 Gy-RT and α-PD-1 antibody. Two-way ANOVA with Sidak’s post-hoc test. ****P< 0.0001.

