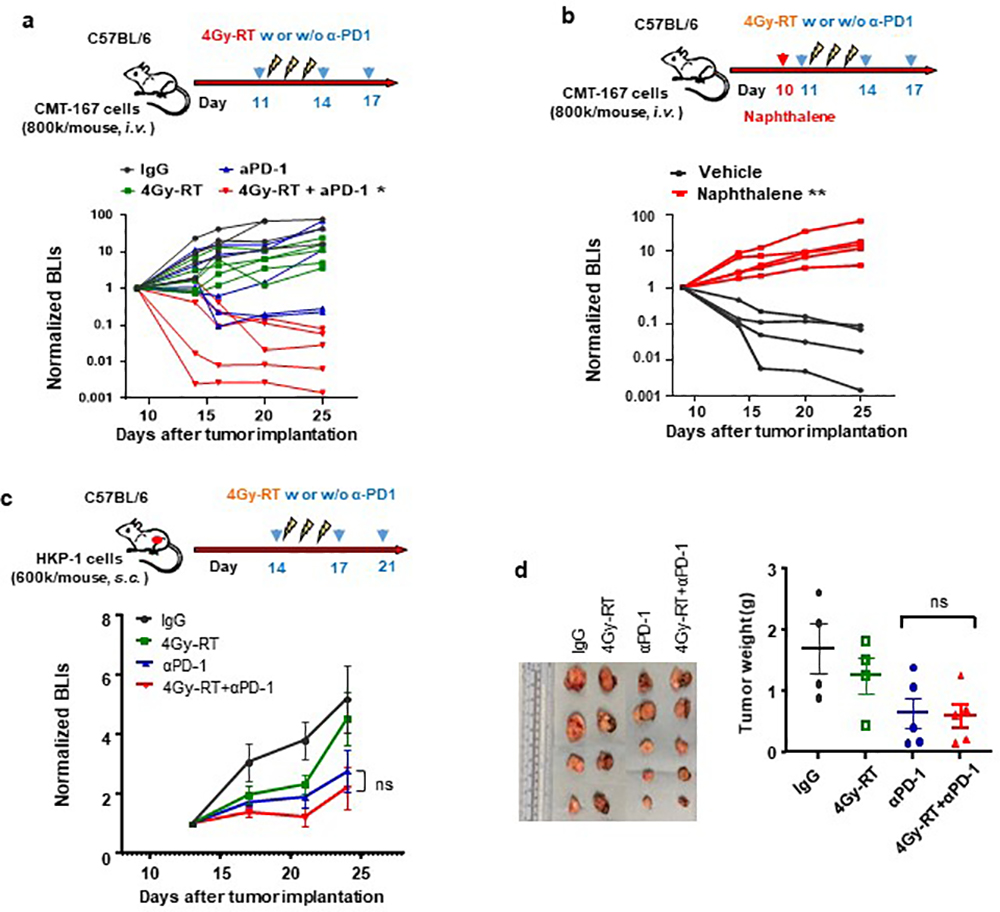
Extended Data Fig. 7. 4Gy-RT enhances efficacy of PD-1 inhibition by activating club cells.
a, Upper: schematic depicting treatment strategy. CMT-167bearing mice were treated with IgG or α-PD1 antibody (0.1 mg/mouse, i.p.) at day 11, 14, and 17. Mice also received mock RT or 4Gy-RT at day 11,12 and 13. Lower: tumor growth curves of CMT-167 mice described in upper panel. n=5 mice. IgG vs.4Gy-RT+ α-PD1: P=0.019; IgG vs.α-PD1: NS; IgG vs.4Gy-RT: NS. two-way ANOVA with Tukey’s post-hoc test. b, Upper: schematic depicting treatment strategy. CMT-167bearing mice were treated with naphthalene (200mg/kg, i.p.) at Day 10 to deplete club cells before radiation. From Day11, mice were treated as described in a. lower: tumor growth curves of CMT-167 mice described in upper panel. Vehicle (n=5 mice) vs. naphthalene (n=4 mice): **P=0.0031. Two way ANOVA with Holm-Sidak’s multiple comparisons test.
c. Upper: schematic depicting treatment strategy. Mice bearing HKP1 subcutaneous tumor were treated with IgG or αPD1 antibody (0.2 mg/mouse, i.p.) at day 14, 17, and 21. Mice also received mock RT or 4Gy-RT at day 14,15 and 16. Lower: tumor growth curves of HKP-1 mice described in upper panel. Data are mean ± SEM. n=5 mice. α-PD1 vs.4Gy-RT+ α-PD1: P=0.99, ns, non-significant. Two-way ANOVA with Tukey’s post-hoc test.
d, HKP1 subcutaneous tumor weights. HKP1 subcutaneous tumors were dissected at Day30. Data are mean ± SEM. IgG and 4Gy-RT: n=4; α-PD1 and 4Gy-RT+α-PD1: n=5 mice. α-PD1 vs.4Gy-RT+α-PD1: P=0.99(ns). One way ANOVA with Sidak’s multiple comparison test.

