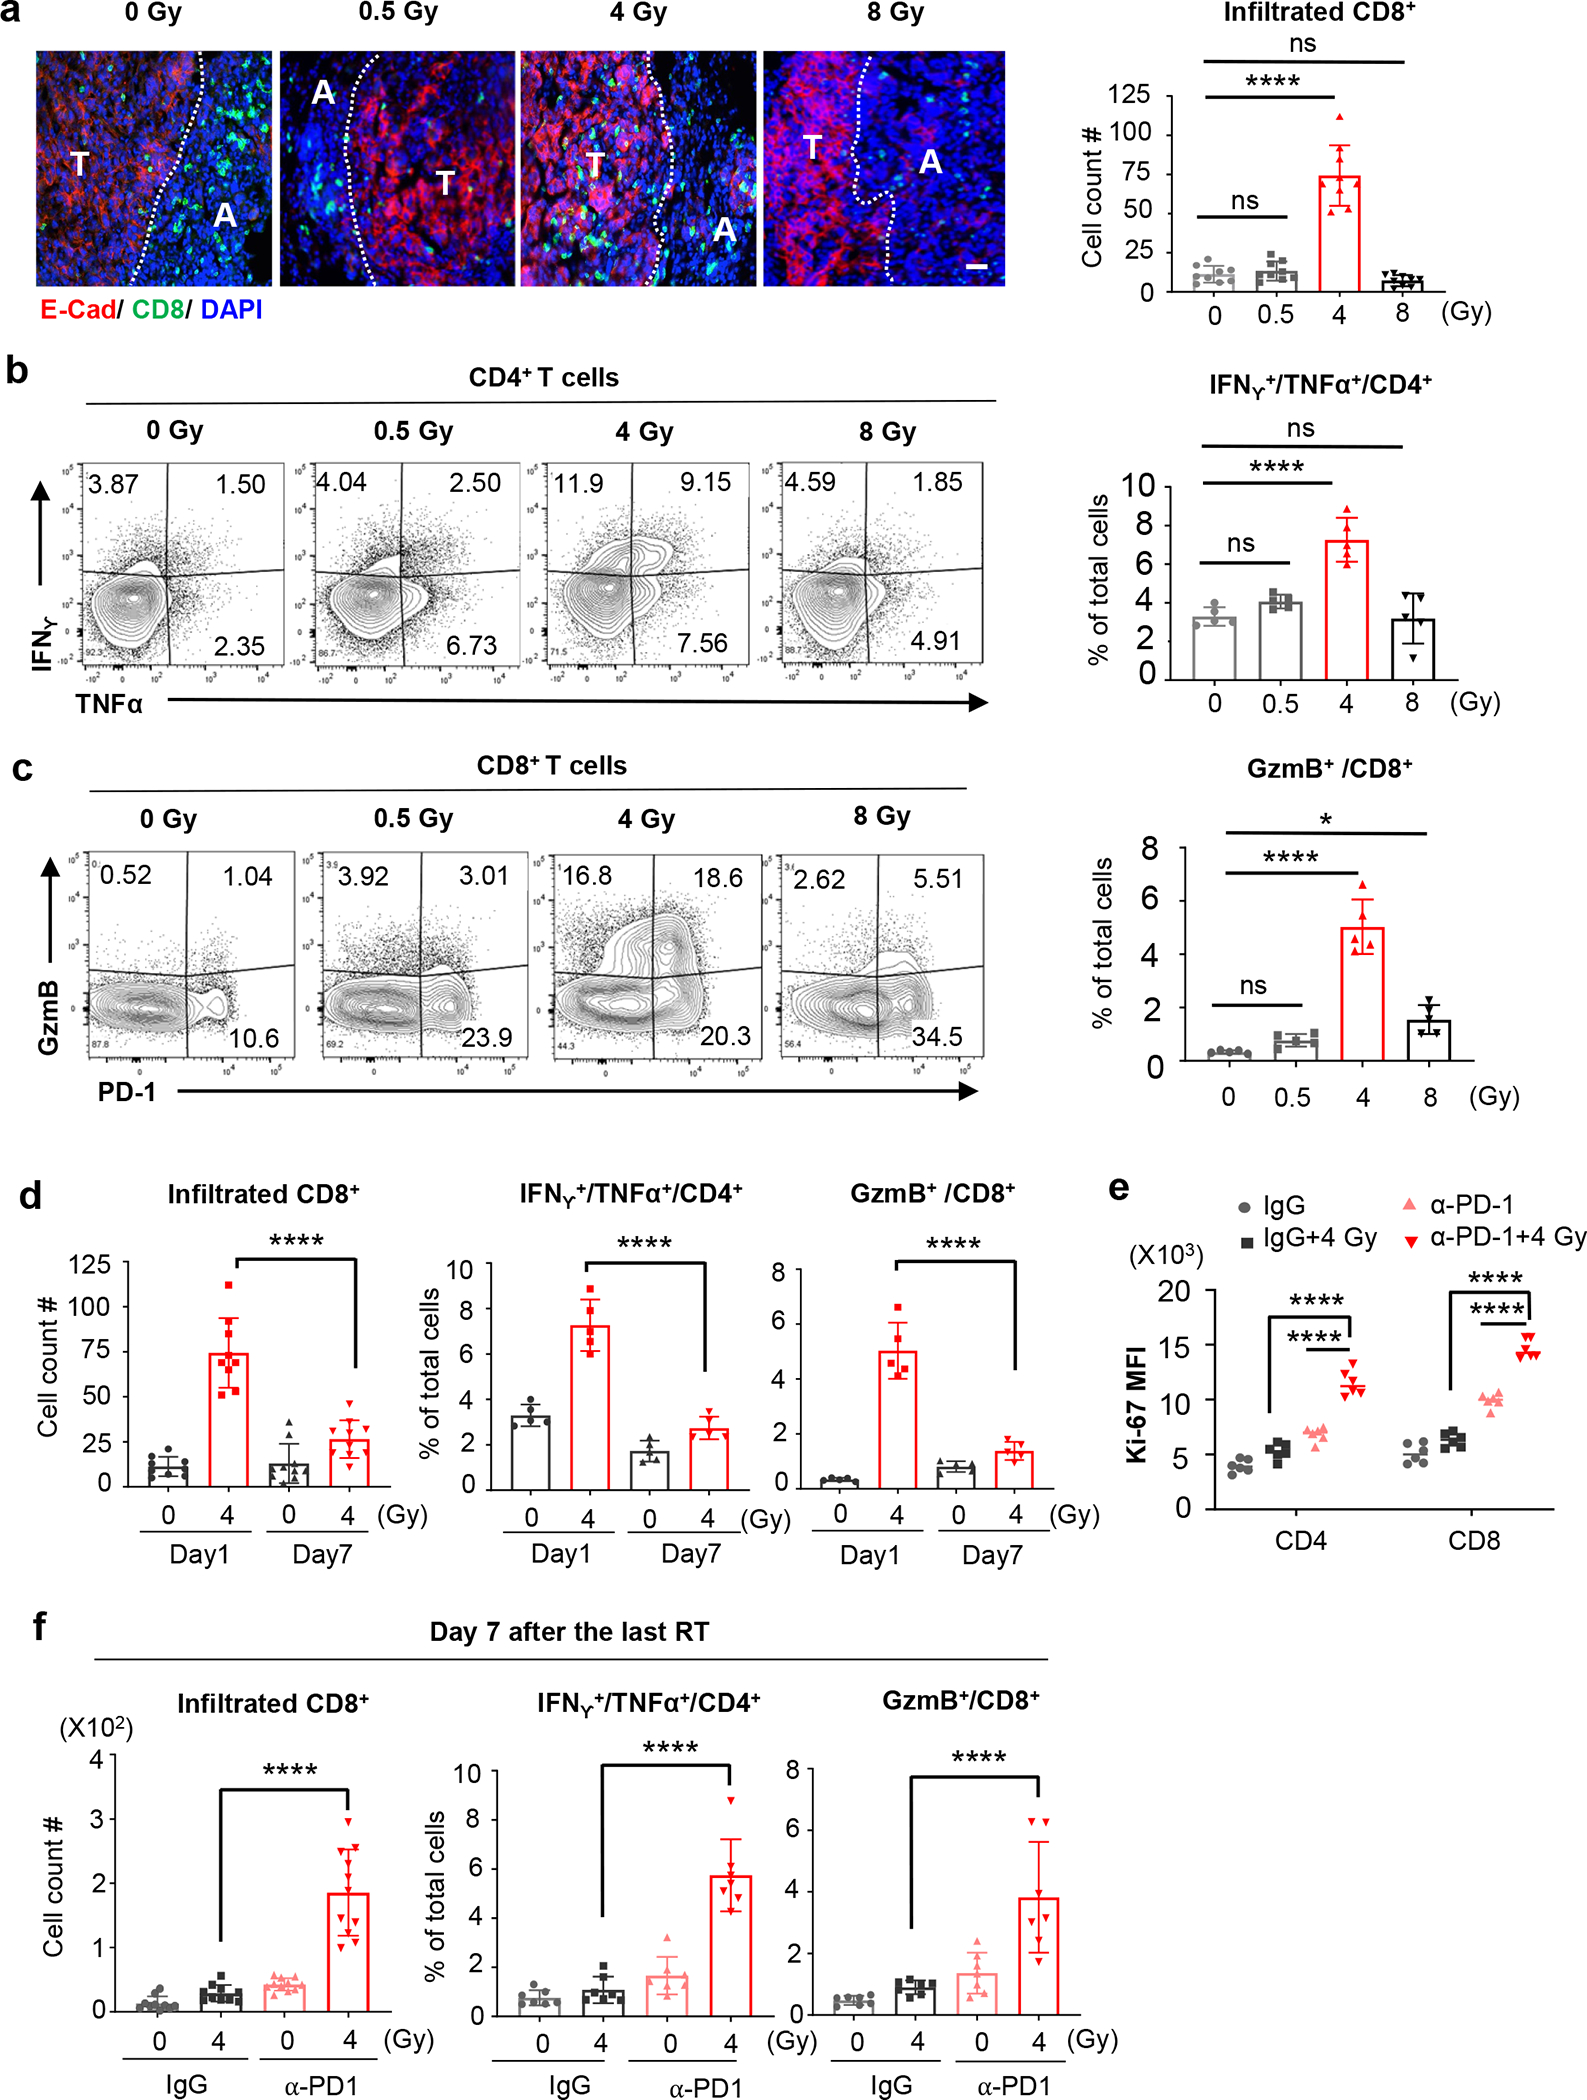
Figure 2. 4Gy-RT increases T cell infiltration and activation in HKP1-bearing lungs.

a, Representative immunofluorescent images of HKP1-bearing lungs (n=9 tissue sections from 4 mice) showing the impact of various doses of RT alone on the infiltration of CD8+ T cells (Green) into E-cadherin+ tumor islets (Red) Tumor (T) and adjacent lung tissue (A) are separated by a dotted line. Right panel: quantification of CD8+ T cells in tumor islets. Cell counts/field were evaluated. Scale Bar: 20μM. Data are mean ± SEM. 0Gy vs. 0.5Gy-RT, P=0.9781; 0Gy vs. 4Gy-RT, ****P<0.0001; 0Gy vs. 8Gy-RT, P=0.8443. One-way ANOVA with Tukey’s post-hoc test.
b, Flow cytometry analysis of IFNγ and TNFα expression by CD4+ T cells in HKP1-bearing lungs after treatment with various doses of RT. Right panel: quantification of IFNγ+/TNFα+/CD4+ T cells. n=5 tumor-bearing lungs. 0Gy vs. 0.5Gy-RT, P=0.5539; 0Gy vs. 4Gy-RT, ****P<0.0001; 0Gy vs. 8Gy-RT, P=0.9978.
c, Flow cytometry analysis of GzmB and PD1 expression by CD8+ T cells in HKP1-bearing lungs after treatment with various doses of RT. Right panel, quantification of GzmB+/CD8+ T cells. n=5 tumor-bearing lungs. 0Gy vs. 0.5Gy-RT, P=0.6599; 0Gy vs. 4Gy-RT, ****P<0.0001; 0Gy vs. 8Gy-RT, *P=0.0239.
d, Quantification of the infiltrated CD8+ T cells (left, Day1 4Gy-RT:n=9 lung sections and Day7 4Gy-RT:n=10 lung sections, ****P<0.0001), IFNγ+/TNFα+/CD4+ (middle, n=5 tumor-bearing lungs, ****P<0.0001), and GzmB+/CD8+ T cells (right, n=5 tumor-bearing lungs, ****P<0.0001) in HKP1 lungs at Day 1 and Day 7 after 0Gy or 4Gy-RT.
e, Ki67 mean fluorescence intensity (MFI) of cytokine+ T cells in HKP1 lungs treated with IgG, IgG+4Gy-RT, α-PD1 or α-PD1+4Gy-RT at Day 7 post-RT. n= 6 tumor-bearing lungs. ****P<0.0001. One-way ANOVA with Tukey’s post-hoc test.
f, Quantification of infiltrated CD8+ T cells (left, Day1 4Gy-RT:n=10 lung sections and Day7 4Gy-RT:n=11 lung sections, ****P<0.0001), IFNγ+/TNFα+/CD4+ T cells (middle, n=7 tumor-bearing lungs, ****P<0.0001), and GzmB+/CD8+ T cells (right, n=7 tumor-bearing lungs, ****P<0.0001) in HKP1 lungs treated with IgG, IgG+4Gy-RT, α-PD1 or α-PD1+4Gy-RT at Day 7 post-RT.
2b-d and 2f: Quantification were performed using cytokine+ T cell % of total single cells of HKP1-bearing lung, Data are mean ± SEM. One-way ANOVA with Tukey’s post-hoc test.
