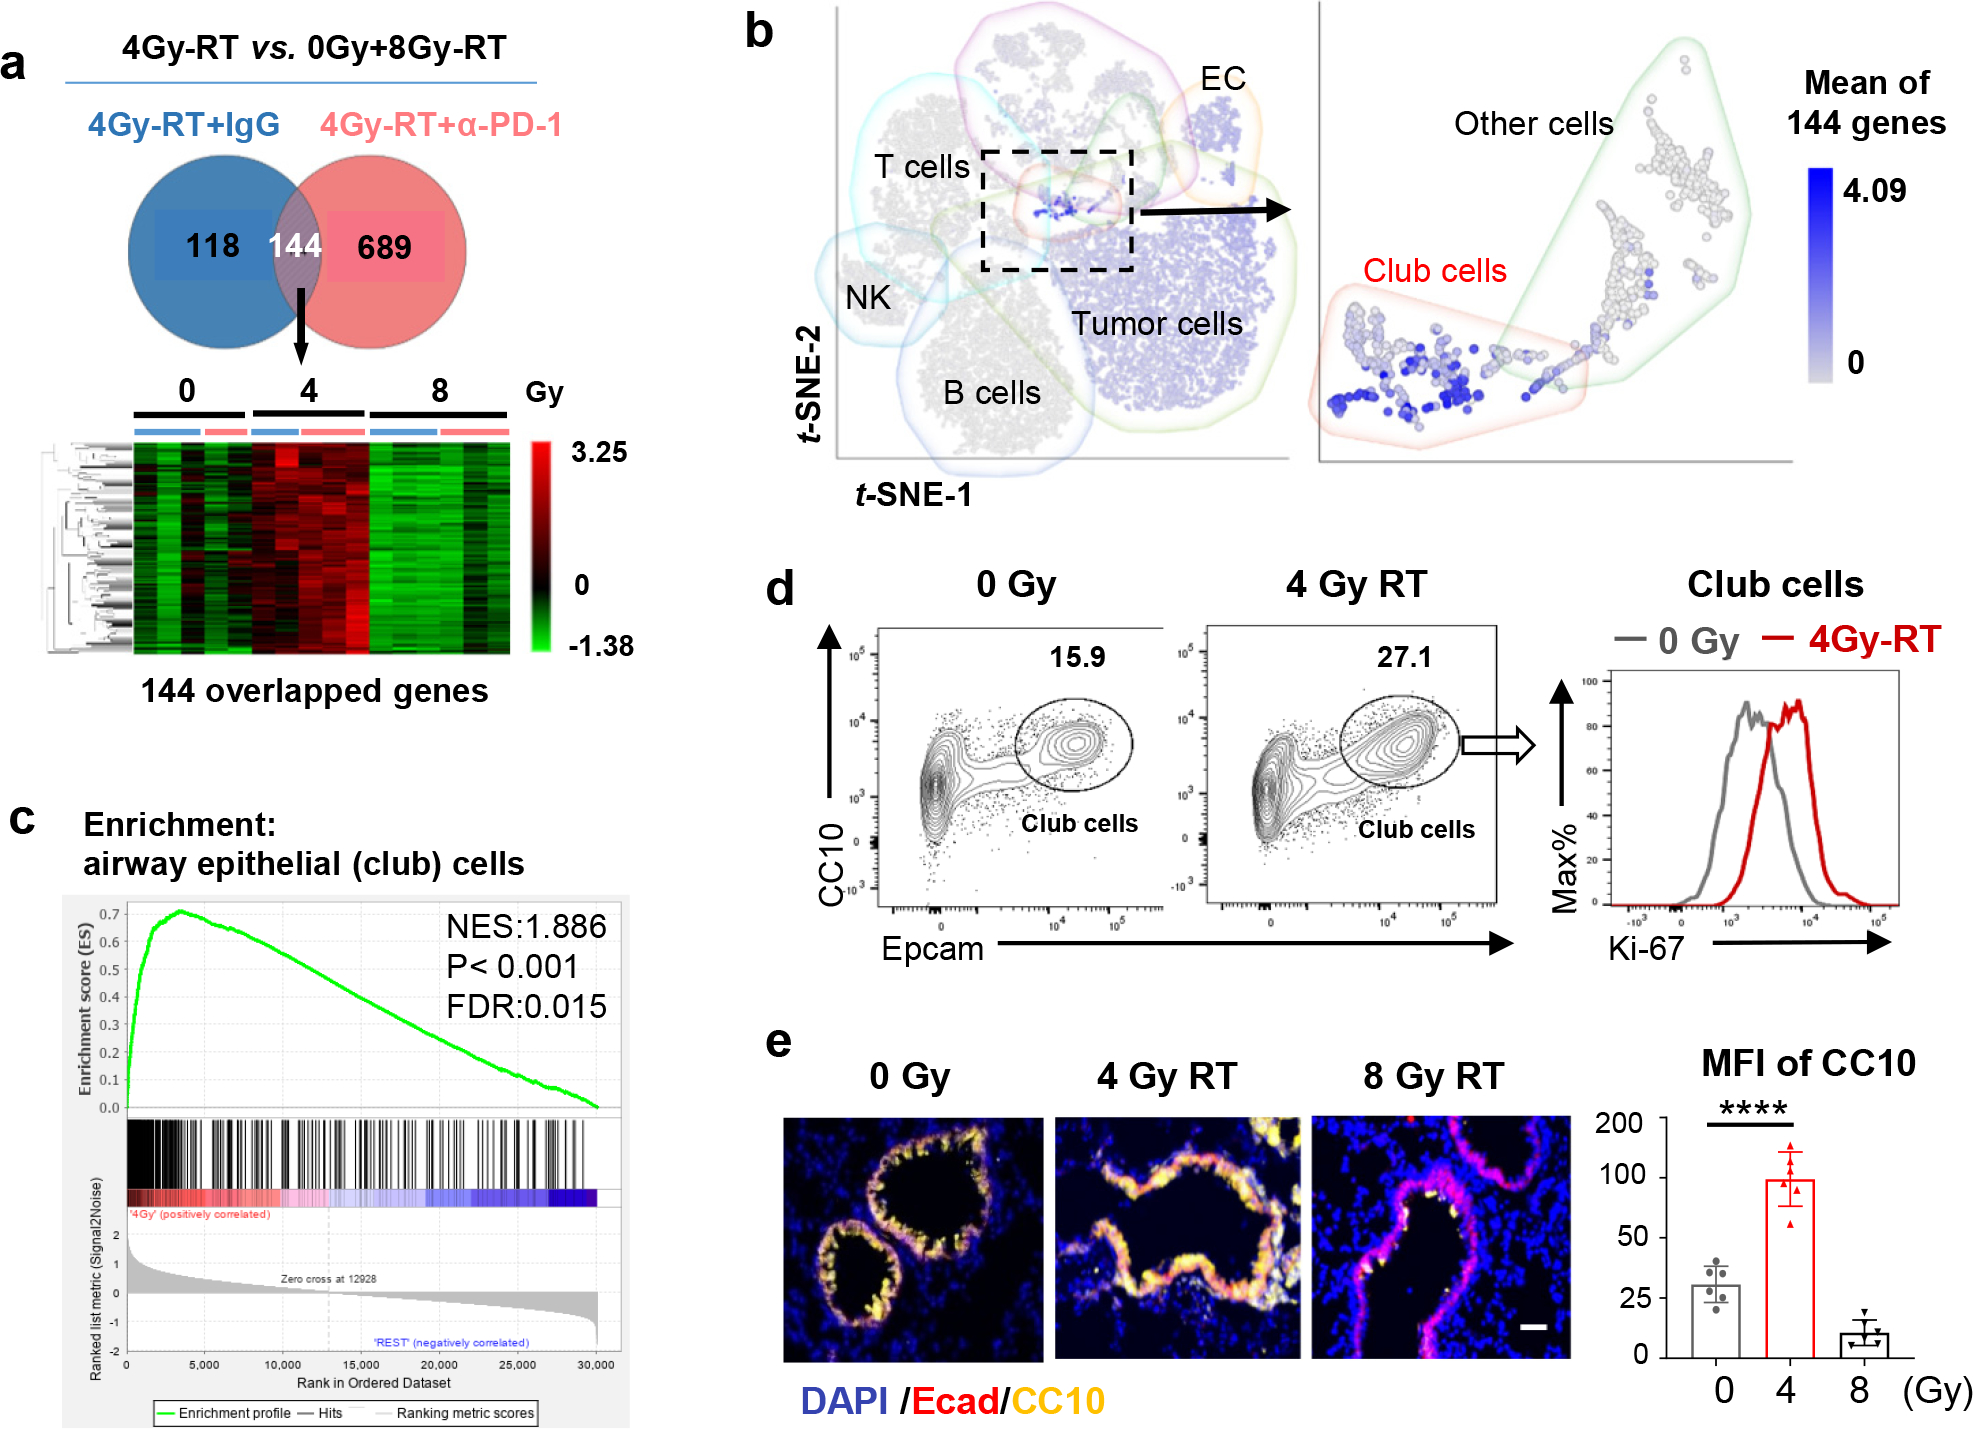
Figure 3. 4Gy-RT activates club cells in the lung microenvironment.

a, RNA-seq analyses HKP1 lungs treated with RT or RT in combination with α-PD1 antibody (each sample pooled from 3 individual mice, 5 samples for 0Gy and 4Gy-RT group, 6 samples for 8Gy-RT group). Genes upregulated specifically by 4Gy-RT (compared to 0Gy and 8Gy-RT) were identified in the IgG or α-PD1 cohort (two-sided adjusted P value <0.01, Fold change ≥ 2, LSMean ≥ 5). The overlapped 144 upregulated genes from two cohorts are highlighted in the heatmap (lower panel).
b, The t-SNE plot of scRNA-seq of 0Gy- and 4Gy-RT-treated HKP1 mice (lung samples pooled from 4 mice/group). The mean expression values of the 144 signature genes are highlighted in various cell clusters.
c, GSEA showing enrichment of club cell signature genes in the 4Gy-RT as compared to the 0Gy and 8Gy-RT groups (n was same as described in 3a). The Nominal P value is not adjusted for gene set size or multiple hypothesis testing.
d, Flow cytometry analysis of club cells (CD45−/mCherry−/CC10+/Epcamhi) in HKP1-lungs treated with 4Gy-RT. Percentages of club cells and their proliferation rates (Ki67+ cells) are shown (n=4 mice).
e, Representative Immunofluorescent images of n= 6 lung sections from 3 mice treated by different doses of RT as indicated. Club cells were stained with Ecadherin (Ecad) and CC10. Quantification was performed with mean fluorescence intensity (MFI). Scale Bar: 20μM. right panel, data are mean ± SEM. ****P<0.0001, One-way ANOVA with Tukey’s post-hoc test.
