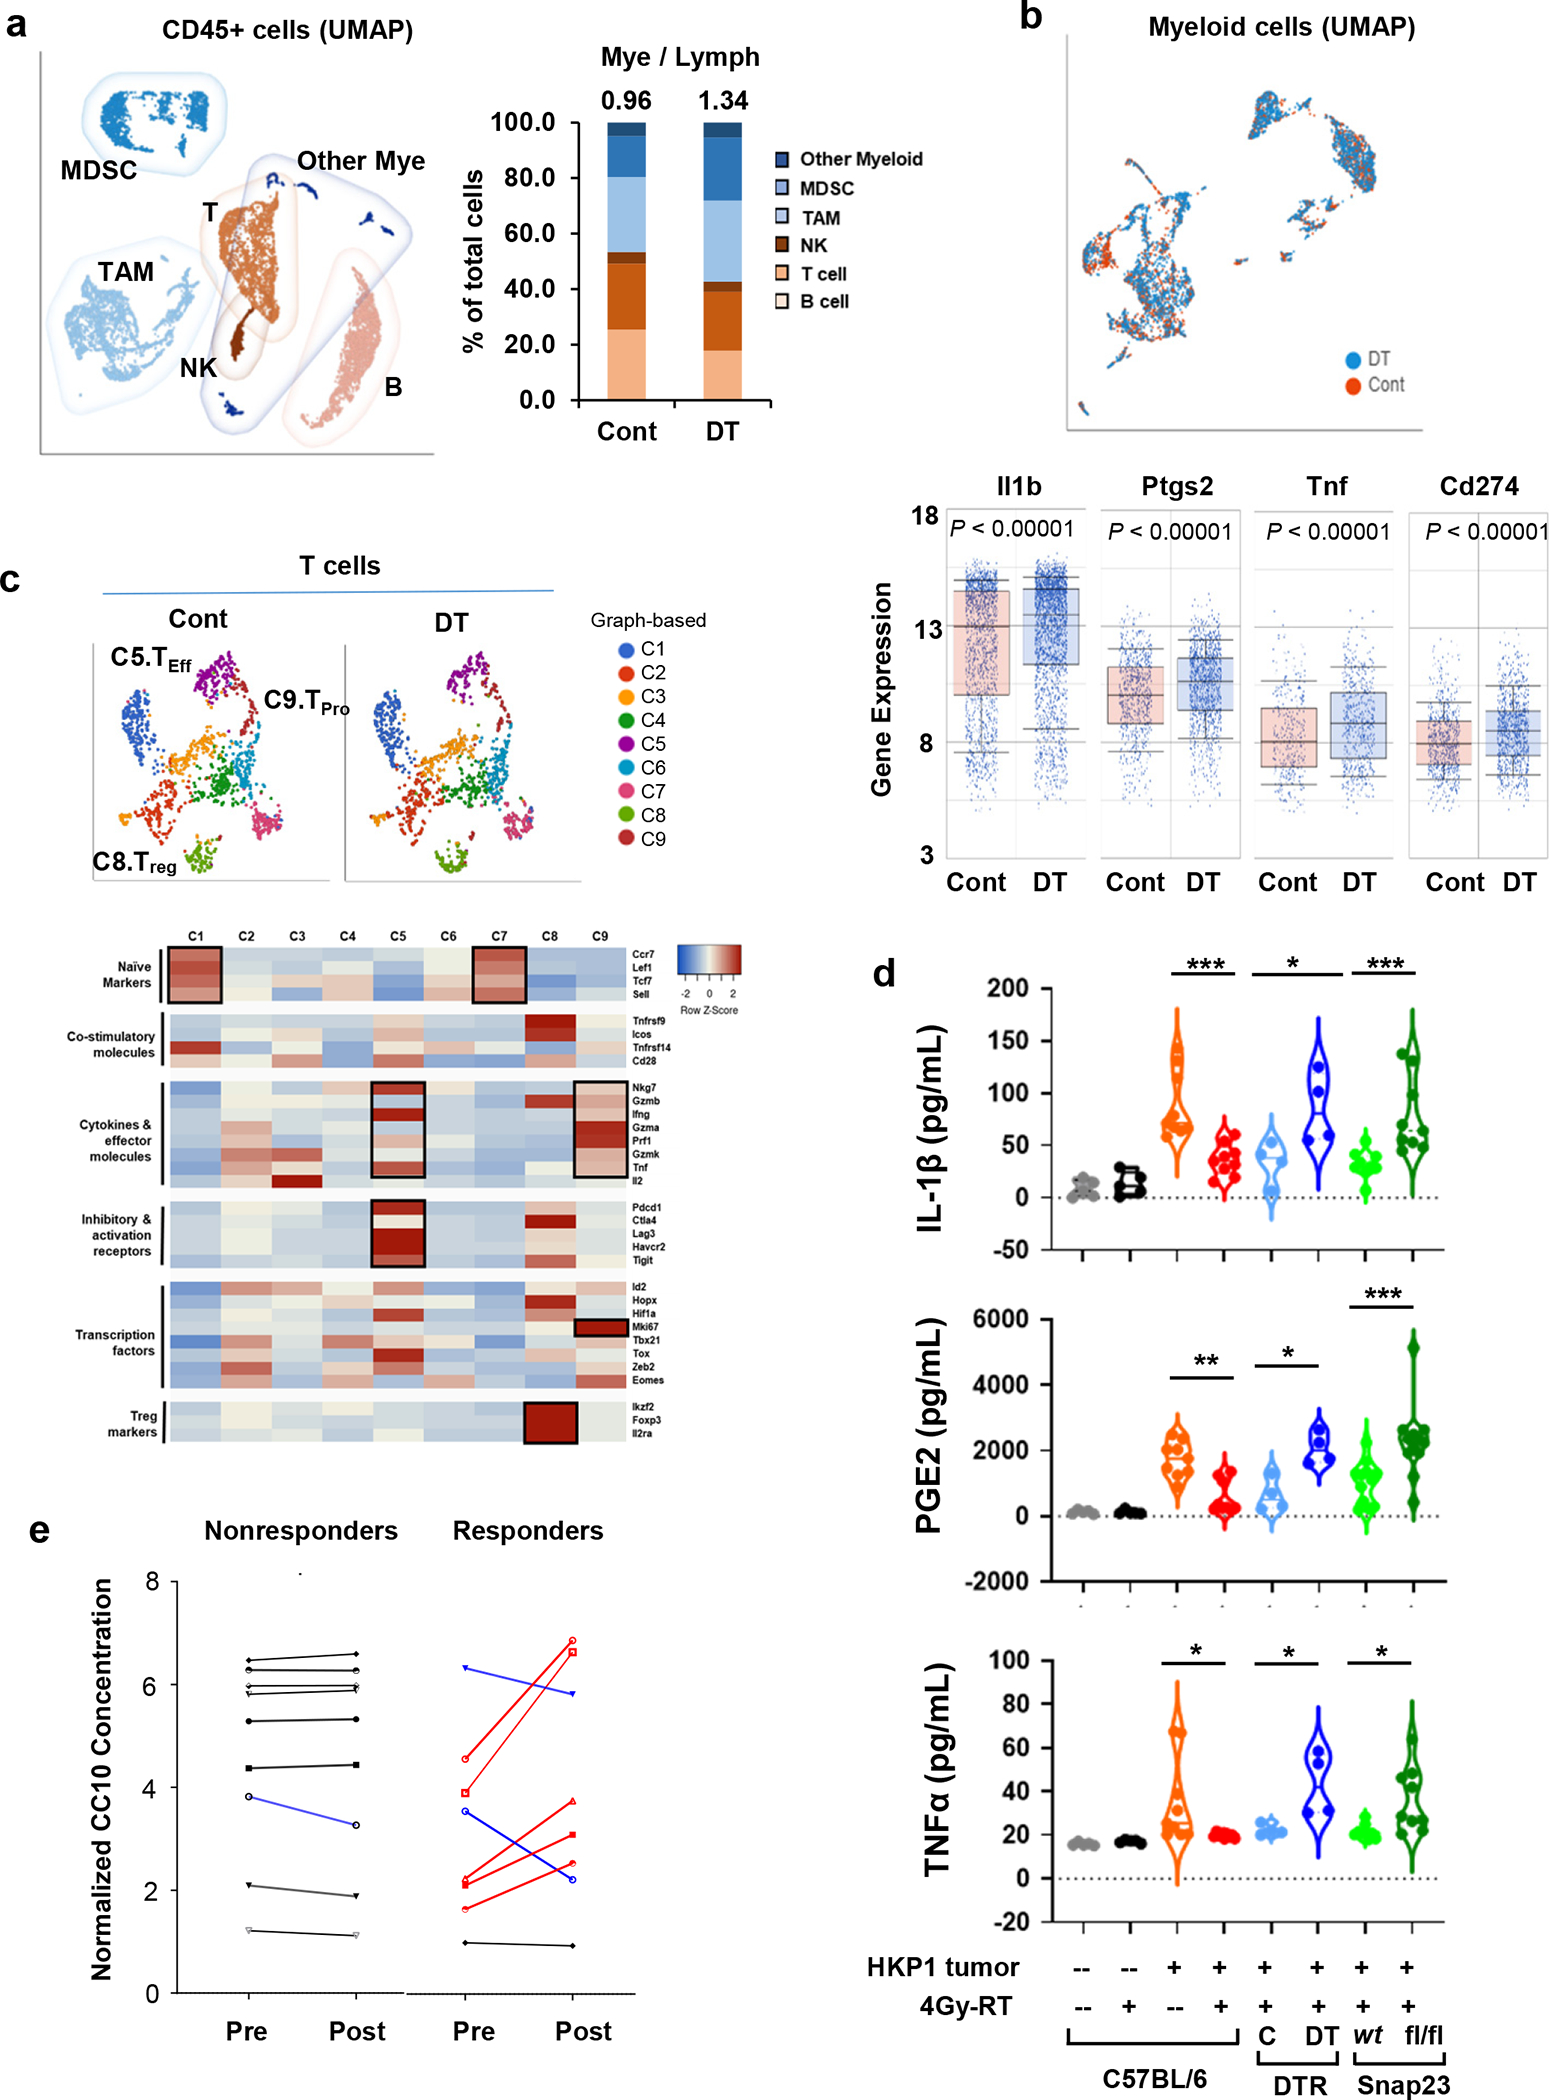
Figure 6. Club cells contribute to the immune landscape in HKP1 mice treated with combination therapy.

a, Left, UMAP depicting discrete clusters of CD45+ cells from PBS-(Cont) or diphtheria toxin (DT)- treated Scgb1a1Cre/iDTR HKP1 mice. Both groups received the combination therapy. Subpopulations of myeloid-derived suppressor cells (MDSCs), Tumor-associated macrophages (TAMs) and other myeloid cells, T cells (T), B cells (B), Natural killer cells (NK) are indicated. Each sample was pooled from 4 mice/group. Right, Quantification of the myeloid- and lymphoid-lineage cells as percentage of the total CD45+ cells. Numbers indicate the ratio of Mye/Lymph.
b, Upper, UMAP of the myeloid cell populations from mice described in a. Lower, the differential expression of inflammation-related genes (Il1b, Ptgs2, Tnf, and Cd274) in the myeloid compartment (n=2396 cells for cont, and n=3124 cells for DT treated sample). Center lines of box plots denote median values. Top whiskers denote 90% percentile; bottom whiskers denote 10% percentile. P< 0.0001, unpaired two-tailed Student t test.
c, Upper, t-SNE plots showing the graph-based classification of T cells from mice described in a. Lower, Heatmap showing feature genes of each T clusters. Of note, C5 (Teff) predominantly expresses the effector cytokines and T cell activation markers; C8 (Treg) shows high expression of Treg markers; and C9 (Tpro) expresses effector cytokines and Ki67. Differentially-expressed genes in each T cluster are highlighted in black boxes.
d, ELISA of inflammatory factors (IL-1β, PGE2 and TNFα) in the BALF. BALF were collected at Day 14 after tumor implantation from mice with or without 4Gy-RT and with or without functional club cells as indicated. Naïve: n=5 mice; HKP1-bearing: n=9 mice; Scgb1a1cre/iDTR: n=4 mice; Scgb1a1cre/Snap23wt or fl/fl: n=9 mice for IL-1β and TNFα, n= 12 mice for PGE2. HKP1-bearing 0Gy vs. 4Gy-RT: ***P=0.0001 (IL-1β), **P=0.0023 (PGE2) and *P=0.0206 (TNFα); Scgb1a1cre/iDTR Cont vs. DT, *P=0.0166 (IL-1β), *P=0.0159 (PGE2) and *P=0.0363 (TNFα); Scgb1a1cre/Snap23wt vs.Scgb1a1cre/Snap23 fl/fl , ***P=0.0008(IL-1β), ***P=0.0001 (PGE2) and *P=0.0264 (TNFα). One-way ANOVA with Sidak’s post-hoc test.
e, ELISA of CC10 in patients’ plasma. NSCLC patient’s blood was collected pre- and 1 day post-radiation. CC10 concentrations in plasma from the same patient were compared and correlated with pathological responses. Patients’plasma showing significant increases are highlighted in red, significant decreases are highlighted in blue. The paired fold changes, non-responders vs. responders, P=0.0301, unpaired two-tailed Student t test. Non-responder: n=9 plasma samples. Responder: n=8 plasma samples.
