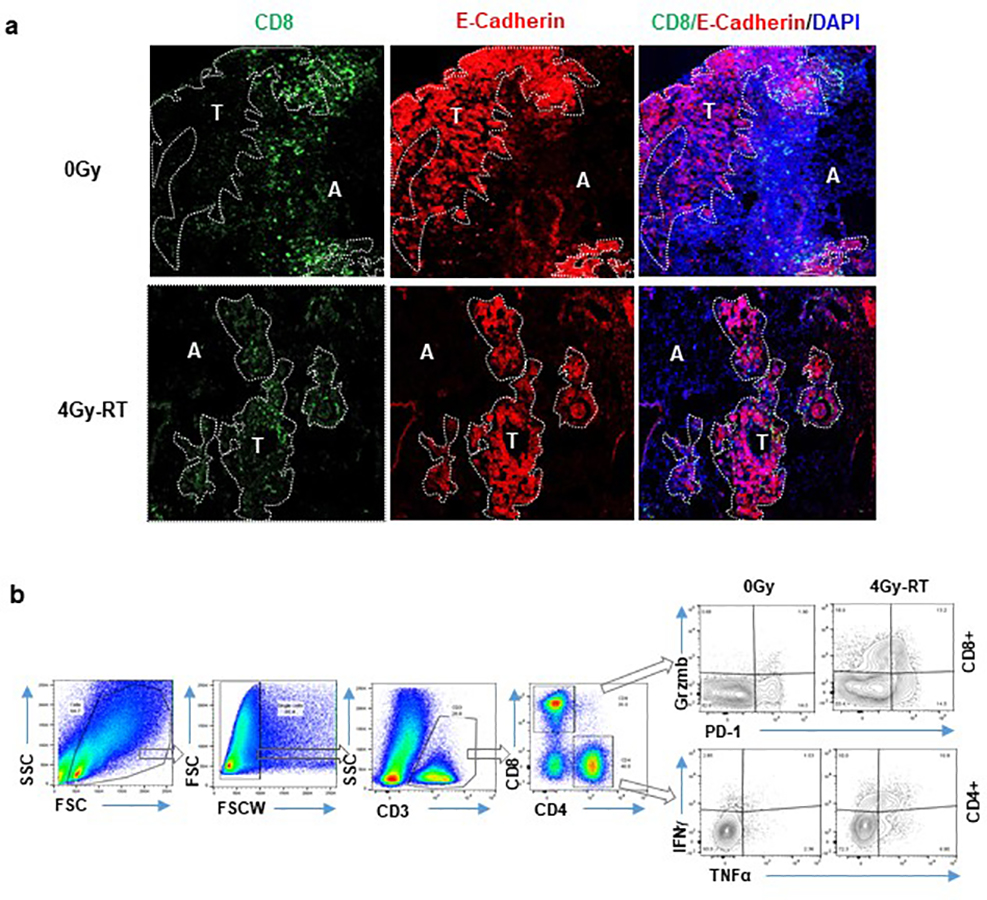
Extended Data Fig. 1. Representative tiled immunofluorescent images of HKP1 lungs.
1a, Stitched microscopy images (10x) showing impact of 4Gy-RT on the infiltration of CD8+ T cells in tumor islets 1 day after last dose of RT. Tiled images (1.6mm × 1.6mm) are shown. CD8 (Green) and E-cadherin (Red) were stained. Tumor (T) and Adjacent lung tissue (A) are separated by dashed lines. n=9 sections from 4 mice/treatment were evaluated. 1b. Example of gating strategy of flow cytometric analyses of T cells. Flow plots were sequentially gated as cells, single cells, CD3+ cells, CD4+ or CD8+; in CD4+ or CD8+ sub-gate, cytokine+ cells were gated based on unstained controls, followed by applying same gates to all the samples. This gating strategy was employed for Fig.2b–2f, Fig.4c (middle and right panels), Fig.5c (middle and right panels), Extended Data Fig.2e, Extended Data Fig.3c, Extended Data Fig.6d and Extended Data Fig.8d.

