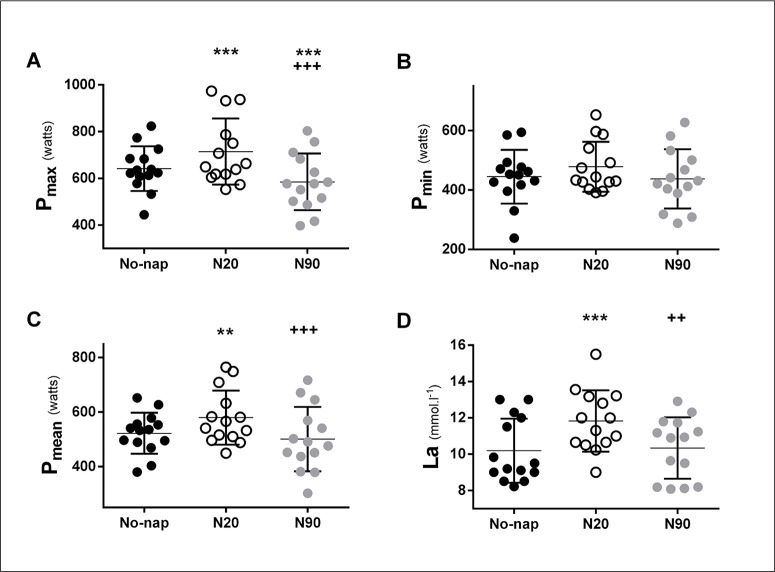
FIG. 2.
Individual maximum (Pmax; A), minimum (Pmin; B) and mean (Pmean; C) powers, and [La]: Plasma lactate (D) after control (No-nap ●), 20 min nap (N20 ○) and 90 min nap (N90 ●). Significance is assessed with a one-way ANOVA and Bonferroni multiple comparison tests. *, **and *** presents a significant difference in comparison with No-nap values at p < 0.05, p < 0.01 and p < 0.001, respectively; +, ++ and +++ presents a significant difference in comparison with N20 values at p < 0.05, p < 0.01 and p < 0.001, respectively. Horizontal and vertical bars represent the group means and standard deviations, respectively.

